Rashid Akmaev, a research scientist at the University of Colorado, explains.
The short answer is yes, and at various times this question of lunar
tides in the atmosphere occupied such famous scientists as Isaac Newton
and Pierre-Simon Laplace, among others. Newton's theory of gravity
provided the first correct explanation of ocean tides and their long
known correlation with the phases of the moon. Roughly a century later
it was also used to predict the existence of atmospheric tides when
Laplace developed a quantitative theory based on a tidal equation now
bearing his name. Laplace's equation describes the motions of an ocean
of uniform depth covering a spherical Earth [see illustration].
At the point on the ocean's surface closest to the moon (point A
in the illustration), the lunar gravitational attractive force is
strongest and it pulls the ocean toward itself. On the opposite side of
Earth (point B), its attractive force is weakest, which allows the ocean
to bulge outward again, in this case away from the moon. As the planet
rotates from west to east the two bulges tend to stay on the Earth-moon
line. (The moon also revolves around Earth in the same direction as
Earth's rotation but at a much slower rate.) For an observer stationed
on the surface and revolving with it, the bulges would appear as a giant
wave, which follows the apparent motion of the moon to the west and has
two crests per lunar day.
https://www.scientificamerican.com/article/does-the-moon-have-a-tida/
Showing posts with label Heenal Tailor. Show all posts
Showing posts with label Heenal Tailor. Show all posts
Tuesday, June 27, 2017

Old Fashioned Ways to Predict the Weather
Old Fashioned Ways to Predict the Weather
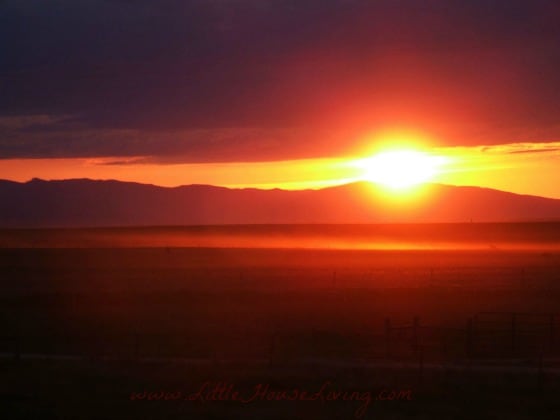
Is it just me or is the evening forecast becoming less and less reliable? No offense to weatherman but it just seems like the weather has a mind of its own and it will never be tamed with computer predictions. (Seems like that's proved year after year with the Farmer's Almanac!)I've always been a big believer in the "crazy" weather prediction methods. I knew that if my grandma's knees hurt than we were in for some rain. And if the cattle started moving quickly to a corner of the field you better be prepared to get indoors as fast as possible.
There are many methods for reading the sky, the animals, and our own bodies to help predict the weather and today you are going to learn all about them. Here are some ways that you can predict the weather forecast.
http://www.littlehouseliving.com/old-fashioned-ways-to-predict-the-weather.html
Barometric Pressure and Migraines: What You Need to Know
Long before meteorologists began making weather forecasts, migraineurs were likely able to predict coming storms with unhappy accuracy. This is because barometric pressure makes itself felt well ahead of time, foretelling the arrival of thunderstorms and other weather patterns that have an effect on migraine patients.
How it Works
Barometric pressure is the method scientists use to measure the atmospheric pressure or weight of the air where it presses on the surface of the earth. This affects the weather by causing changes to the way air currents move around the earth. A device called a barometer is used to identify the pressure, and the barometric reading is helpful in forecasting incoming weather changes. High barometric pressure is usually linked to clear, sunny weather, while low pressure provides the perfect conditions for clouds and moisture to develop.http://blog.themigrainereliefcenter.com/barometric-pressure-and-migraines-what-you-need-to-know

Tornado Disaster -- Texas, May 1997
On May 27, 1997, multiple tornadoes swept through Williamson
and Travis counties in central Texas. The tornadoes caused 32
injuries, 29 deaths, and an estimated $20 million in personal and
commercial insured losses. This report summarizes the injuries and
deaths associated with these tornadoes based on information from
emergency department and hospital records and death certificates.
Three tornadoes swept through the towns of Jarrell, Cedar Park, and Pedernales Valley at approximately 3:40 p.m., 4:00 p.m., and 4:50 p.m., respectively (Table_1). The first tornado, a slow-moving multivortex F-5 (Fujita Tornado Intensity Scale) (Table_2), swept a path 7.6 miles long and approximately 1320 yards wide through a residential subdivision of Jarrell, a predominantly rural town in Williamson County, destroying 30 permanent homes, eight mobile homes, and three businesses (Table_1). The second tornado (F-3) touched down in Cedar Park in Williamson County and swept a path 9.2 miles long and 250 yards wide, destroying 11 permanent homes and three businesses (Table_1). The third tornado (F-4) swept a path 5.6 miles long and 440 yards wide through Pedernales Valley, a heavily wooded area in western Travis County, destroying 15 permanent homes, three mobile homes, and two businesses (Table_1).
https://www.cdc.gov/mmwr/preview/mmwrhtml/00049839.htm
Three tornadoes swept through the towns of Jarrell, Cedar Park, and Pedernales Valley at approximately 3:40 p.m., 4:00 p.m., and 4:50 p.m., respectively (Table_1). The first tornado, a slow-moving multivortex F-5 (Fujita Tornado Intensity Scale) (Table_2), swept a path 7.6 miles long and approximately 1320 yards wide through a residential subdivision of Jarrell, a predominantly rural town in Williamson County, destroying 30 permanent homes, eight mobile homes, and three businesses (Table_1). The second tornado (F-3) touched down in Cedar Park in Williamson County and swept a path 9.2 miles long and 250 yards wide, destroying 11 permanent homes and three businesses (Table_1). The third tornado (F-4) swept a path 5.6 miles long and 440 yards wide through Pedernales Valley, a heavily wooded area in western Travis County, destroying 15 permanent homes, three mobile homes, and two businesses (Table_1).
https://www.cdc.gov/mmwr/preview/mmwrhtml/00049839.htm
Monday, June 26, 2017
Half of Weather Disasters Linked to Climate Change
From a deadly snowstorm in Nepal to a heat wave in Argentina that
crashed power supplies, at least 14 extreme weather events last year
bore the fingerprints of human-induced climate change, an international
team of scientists reported Thursday.
Researchers examined 28 weather extremes on all seven continents to
see if they were influenced by climate change or were just normal
weather. Their conclusion: Half of them showed some role of climate
change.
“We hope that this will help people see how climate change is
affecting their day-to-day lives,” says lead editor Stephanie C. Herring
of the National Oceanic and Atmospheric Administration’s National
Centers for Environmental Information.
![Picture of snowstorm Nepal]()
![Picture of snowstorm Nepal]()
![Picture of]()
![Picture of]() http://news.nationalgeographic.com/2015/11/151105-climate-weather-disasters-drought-storms/
http://news.nationalgeographic.com/2015/11/151105-climate-weather-disasters-drought-storms/
The Impact of Climate Change on Natural Disasters
Climate change may not be responsible for the recent skyrocketing cost
of natural disasters, but it is very likely that it will impact future
catastrophes. Climate models provide a glimpse of the future, and while
they do not agree on all of the details, most models predict a few
general trends. First, according to the Intergovernmental Panel on
Climate Change, an increase of greenhouse gases in the atmosphere will
probably boost temperatures over most land surfaces, though the exact
change will vary regionally. More uncertain—but possible—outcomes of an
increase in global temperatures include increased risk of drought and
increased intensity of storms, including tropical cyclones with higher
wind speeds, a wetter Asian monsoon, and, possibly, more intense
mid-latitude storms.

https://earthobservatory.nasa.gov/Features/RisingCost/rising_cost5.php
https://earthobservatory.nasa.gov/Features/RisingCost/rising_cost5.php
How the Warming Arctic Affects Us All
The Arctic includes the Arctic Ocean and northern parts of Canada,
Russia, Denmark (Greenland), Norway, the United States (Alaska), Sweden,
Finland and Iceland. Arctic winters are cold and for a time, dark 24
hours a day. The ocean surface begins to freeze in mid-September and
remains frozen until March, when it melts again through summer as the
region gets sunlight 24 hours a day. The term “ice-free Arctic” refers
to the Arctic Ocean in summer time.
During the last three decades, about 50 percent of Arctic sea ice cover, 80 percent of sea ice volume (thickness) and much of the old multiyear ice have been lost.
During the 1980s, half the winter ice remained for one or more seasons, but by 2012, only 25 percent of the ice that remained was more than a year old, with the rest thinner and more easily melted. Many climate models predicted that summer sea ice would remain through this century and into the next, so the speed at which sea ice loss is occurring has taken scientists by surprise.
http://blogs.ei.columbia.edu/2012/12/06/how-the-warming-arctic-affects-us-all/
During the last three decades, about 50 percent of Arctic sea ice cover, 80 percent of sea ice volume (thickness) and much of the old multiyear ice have been lost.
During the 1980s, half the winter ice remained for one or more seasons, but by 2012, only 25 percent of the ice that remained was more than a year old, with the rest thinner and more easily melted. Many climate models predicted that summer sea ice would remain through this century and into the next, so the speed at which sea ice loss is occurring has taken scientists by surprise.
http://blogs.ei.columbia.edu/2012/12/06/how-the-warming-arctic-affects-us-all/
Arctic ice melt 'already affecting weather patterns where you live right now'
The dramatic melting of Arctic ice
is already driving extreme weather that affects hundreds of millions of
people across North America, Europe and Asia, leading climate
scientists have told the Guardian.
Severe “snowmageddon” winters are now strongly linked to soaring polar temperatures, say researchers, with deadly summer heatwaves and torrential floods also probably linked. The scientists now fear the Arctic meltdown has kickstarted abrupt changes in the planet’s swirling atmosphere, bringing extreme weather in heavily populated areas to the boil.
The northern ice cap has been shrinking since the 1970s, with global warming driving the loss of about three-quarters of its volume so far. But the recent heat in the Arctic has shocked scientists, with temperatures 33C above average in parts of the Russian Arctic and 20C higher in some other places.
In November, ice levels hit a record low, and we are now in “uncharted territory”, said Prof Jennifer Francis, an Arctic climate expert at Rutgers University in the US, who first became interested in the region when she sailed through it on a round-the-world trip in the 1980s.
“These rapid changes in the Arctic are affecting weather patterns where you live right now,” she said. “In the past you have had natural variations like El Niño, but they have never happened before in combination with this very warm Arctic, so it is a whole new ball game.
https://www.theguardian.com/environment/2016/dec/19/arctic-ice-melt-already-affecting-weather-patterns-where-you-live-right-now
Severe “snowmageddon” winters are now strongly linked to soaring polar temperatures, say researchers, with deadly summer heatwaves and torrential floods also probably linked. The scientists now fear the Arctic meltdown has kickstarted abrupt changes in the planet’s swirling atmosphere, bringing extreme weather in heavily populated areas to the boil.
The northern ice cap has been shrinking since the 1970s, with global warming driving the loss of about three-quarters of its volume so far. But the recent heat in the Arctic has shocked scientists, with temperatures 33C above average in parts of the Russian Arctic and 20C higher in some other places.
In November, ice levels hit a record low, and we are now in “uncharted territory”, said Prof Jennifer Francis, an Arctic climate expert at Rutgers University in the US, who first became interested in the region when she sailed through it on a round-the-world trip in the 1980s.
“These rapid changes in the Arctic are affecting weather patterns where you live right now,” she said. “In the past you have had natural variations like El Niño, but they have never happened before in combination with this very warm Arctic, so it is a whole new ball game.
https://www.theguardian.com/environment/2016/dec/19/arctic-ice-melt-already-affecting-weather-patterns-where-you-live-right-now
2016 Antarctic Ozone Hole Attains Moderate Size, Consistent With Scientific Expectations
The hole in Earth’s ozone layer that forms over Antarctica each
September grew to about 8.9 million square miles in 2016 before starting
to recover, according to scientists from NASA and the National Oceanic
and Atmospheric Administration (NOAA) who monitor the annual phenomenon.
“This year we saw an ozone hole that was just below average size,” said Paul A. Newman, chief scientist for Earth Sciences at NASA's Goddard Space Flight Center in Greenbelt, Maryland. “What we’re seeing is consistent with our expectation and our understanding of ozone depletion chemistry and stratospheric weather.”
At its peak on Sept. 28, 2016, the ozone hole extended across an area nearly three times the size of the continental United States. The average area of the hole observed since 1991 has been roughly 10 million square miles.
In 2015 the ozone hole grew to 10.9 million square miles, 2 million square miles larger than this year, before returning to relatively normal summer levels. Its larger size last year was due to colder-than-average temperatures in the stratosphere that amplified the destruction of ozone by sunlight reacting with chlorine and bromine from man-made chemicals, scientists said. In 2016, warmer stratospheric temperatures constrained the growth of the ozone hole.
Ozone, which occurs naturally in small amounts in the atmosphere, is comprised of three oxygen atoms as opposed to the two that make up the much more abundant molecular oxygen.. High in the stratosphere, roughly 6 to 30 miles above the surface, the ozone layer acts like sunscreen, shielding Earth from potentially harmful ultraviolet radiation that can cause skin cancer, cataracts and suppress immune systems, as well as damage plants. Ozone is also one of the primary greenhouse gasses that regulate Earth’s temperature.
 At its peak on Sept. 28, 2016, the ozone hole extended across an area
nearly three times the size of the continental United States. The purple
and blue colors are where there is the least ozone, and the yellows and
reds are where there is more ozone.
At its peak on Sept. 28, 2016, the ozone hole extended across an area
nearly three times the size of the continental United States. The purple
and blue colors are where there is the least ozone, and the yellows and
reds are where there is more ozone.
https://www.nasa.gov/feature/Goddard/2016/antarctic-ozone-hole-attains-moderate-size
“This year we saw an ozone hole that was just below average size,” said Paul A. Newman, chief scientist for Earth Sciences at NASA's Goddard Space Flight Center in Greenbelt, Maryland. “What we’re seeing is consistent with our expectation and our understanding of ozone depletion chemistry and stratospheric weather.”
At its peak on Sept. 28, 2016, the ozone hole extended across an area nearly three times the size of the continental United States. The average area of the hole observed since 1991 has been roughly 10 million square miles.
In 2015 the ozone hole grew to 10.9 million square miles, 2 million square miles larger than this year, before returning to relatively normal summer levels. Its larger size last year was due to colder-than-average temperatures in the stratosphere that amplified the destruction of ozone by sunlight reacting with chlorine and bromine from man-made chemicals, scientists said. In 2016, warmer stratospheric temperatures constrained the growth of the ozone hole.
Ozone, which occurs naturally in small amounts in the atmosphere, is comprised of three oxygen atoms as opposed to the two that make up the much more abundant molecular oxygen.. High in the stratosphere, roughly 6 to 30 miles above the surface, the ozone layer acts like sunscreen, shielding Earth from potentially harmful ultraviolet radiation that can cause skin cancer, cataracts and suppress immune systems, as well as damage plants. Ozone is also one of the primary greenhouse gasses that regulate Earth’s temperature.
At its peak on Sept. 28, 2016, the ozone hole extended across an area
nearly three times the size of the continental United States. The purple
and blue colors are where there is the least ozone, and the yellows and
reds are where there is more ozone.https://www.nasa.gov/feature/Goddard/2016/antarctic-ozone-hole-attains-moderate-size
How is Earth's atmosphere losing its most important layer?
The ozone layer is a belt of the naturally occurring gas "ozone." It
sits 9.3 to 18.6 miles (15 to 30 kilometers) above Earth, and serves as a
shield from the harmful ultraviolet B (UVB) radiation emitted by the
sun.
Ozone is a highly reactive molecule that contains three oxygen atoms.
It is constantly being formed and broken down in the high atmosphere,
6.2 to 31 miles (10 to 50 kilometers) above Earth, in the region called
the stratosphere.
![Picture of clouds above Earth]()
![Picture of clouds above Earth]()
![Picture of clouds above Earth]()
http://www.nationalgeographic.com/environment/global-warming/ozone-depletion/
![Picture of clouds above Earth]()
Today, there is widespread concern that the ozone layer is
deteriorating due to the release of pollution containing the chemicals
chlorine and bromine. Such deterioration allows large amounts of
ultraviolet B rays to reach Earth, which can cause skin cancer and
cataracts in humans and harm animals as well.
Extra ultraviolet B radiation reaching Earth also inhibits the
reproductive cycle of phytoplankton, single-celled organisms such as
algae that make up the bottom rung of the food chain. Biologists fear
that reductions in phytoplankton populations will in turn lower the
populations of other animals. Researchers also have documented changes
in the reproductive rates of young fish, shrimp, and crabs as well as
frogs and salamanders exposed to excess ultraviolet B.
![Picture of clouds above Earth]()
http://www.nationalgeographic.com/environment/global-warming/ozone-depletion/
Climate change: How do we know?
he current warming trend is of particular significance because most
of it is extremely likely (greater than 95 percent probability) to be
the result of human activity since the mid-20th century and proceeding at a rate that is unprecedented over decades to millennia.1
Earth-orbiting satellites and other technological advances have enabled scientists to see the big picture, collecting many different types of information about our planet and its climate on a global scale. This body of data, collected over many years, reveals the signals of a changing climate.
The heat-trapping nature of carbon dioxide and other gases was demonstrated in the mid-19th century.2 Their ability to affect the transfer of infrared energy through the atmosphere is the scientific basis of many instruments flown by NASA. There is no question that increased levels of greenhouse gases must cause the Earth to warm in response.
https://climate.nasa.gov/evidence/
![This graph, based on the comparison of atmospheric samples contained in ice cores and more recent direct measurements, provides evidence that atmospheric CO2 has increased since the Industrial Revolution. (Source: [[LINK||http://www.ncdc.noaa.gov/paleo/icecore/||NOAA]])](https://climate.nasa.gov/system/content_pages/main_images/203_co2-graph-021116.jpeg)
Earth-orbiting satellites and other technological advances have enabled scientists to see the big picture, collecting many different types of information about our planet and its climate on a global scale. This body of data, collected over many years, reveals the signals of a changing climate.
The heat-trapping nature of carbon dioxide and other gases was demonstrated in the mid-19th century.2 Their ability to affect the transfer of infrared energy through the atmosphere is the scientific basis of many instruments flown by NASA. There is no question that increased levels of greenhouse gases must cause the Earth to warm in response.
https://climate.nasa.gov/evidence/
Dangerous heat wave scorches Southwestern US
A
rare, dangerous and potentially deadly heat wave is progressing into
the workweek. If it's not already hot enough, the high temperatures in
some areas haven't even reached their peaks.

The torrid heat is a fitting welcome to the official start of summer on Wednesday, when the US will get a luminous view of the solstice sky.
Sacramento,
California, saw record high temperatures of 106 degrees on Sunday, heat
last seen almost 75 years ago, when it reached 105 degrees Fahrenheit.
http://www.cnn.com/2017/06/16/us/weather-dangerous-heat-wave/index.html
Impact of climate change on skin cancer
Ozone depletion and climate change are separate entities which are
intricately linked. They both have the potential to increase the
incidence of skin cancer through different means. Over the last 30 years
ozone depletion has received much of the attention, leading to the
Montreal Protocol; heralded by Kofi Annan as ‘perhaps the single most
successful international agreement to date’. Ozone depletion has lead to
an increase in skin cancers and worryingly this is still rising. The
depletion will however peak and then the ozone layer will begin to
repair itself. Focus must now shift towards analysing the social and
behavioural changes that will come about through climate change. Warmer,
drier weather in the UK is likely to encourage people to spend more
time outdoors and increase their exposure to UVR. The consequence will
be an increase in the incidence of skin cancer brought about by
behavioural change rather than environmental change. The world has had
30 years of public health initiatives and awareness campaigns. These
must be heeded and acted upon now to protect the public from this
preventable threat.
https://www.ncbi.nlm.nih.gov/pmc/articles/PMC2697050/
https://www.ncbi.nlm.nih.gov/pmc/articles/PMC2697050/
Tuesday, June 13, 2017
Antarctic Peninsula ice more stable than thought
Glacier flow at the southern Antarctic Peninsula has increased since the
1990s, but a new study has found the change to be only a third of what
was recently reported.

An international team of researchers, led by the UK Centre for Polar Observation and Modelling at the University of Leeds, are the first to map the change in ice speed. The team collated measurements recorded by five different satellites to track changes in the speed of more than 30 glaciers since 1992.
The findings, published today in Geophysical Research Letters, represent the first detailed assessment of changing glacier flow in Western Palmer Land -- the southwestern corner of the Antarctic Peninsula.
The new Leeds led research calls into question a recent study from the University of Bristol that reported 45 cubic kilometres per year increase in ice loss from the sector. The Leeds research found the increase to be three times smaller.
https://www.sciencedaily.com/releases/2017/05/170502084037.htm
An international team of researchers, led by the UK Centre for Polar Observation and Modelling at the University of Leeds, are the first to map the change in ice speed. The team collated measurements recorded by five different satellites to track changes in the speed of more than 30 glaciers since 1992.
The findings, published today in Geophysical Research Letters, represent the first detailed assessment of changing glacier flow in Western Palmer Land -- the southwestern corner of the Antarctic Peninsula.
The new Leeds led research calls into question a recent study from the University of Bristol that reported 45 cubic kilometres per year increase in ice loss from the sector. The Leeds research found the increase to be three times smaller.
https://www.sciencedaily.com/releases/2017/05/170502084037.htm
Tornado strength, frequency, linked to climate change
New research shows that climate change may be playing a key role in the
strength and frequency of tornadoes hitting the United States.

Published Wednesday in the journal Climate Dynamics, Professor James Elsner writes that though tornadoes are forming fewer days per year, they are forming at a greater density and strength than ever before. So, for example, instead of one or two forming on a given day in an area, there might be three or four occurring.
"We may be less threatened by tornadoes on a day-to-day basis, but when they do come, they come like there's no tomorrow," Elsner said.
https://www.sciencedaily.com/releases/2014/08/140806154011.htm
Published Wednesday in the journal Climate Dynamics, Professor James Elsner writes that though tornadoes are forming fewer days per year, they are forming at a greater density and strength than ever before. So, for example, instead of one or two forming on a given day in an area, there might be three or four occurring.
"We may be less threatened by tornadoes on a day-to-day basis, but when they do come, they come like there's no tomorrow," Elsner said.
https://www.sciencedaily.com/releases/2014/08/140806154011.htm
Lasting severe weather impact found in feathers of young birds
While studying a ground-nesting bird population near El Reno, Okla., a
research team found that stress during a severe weather outbreak of May
31, 2013, had manifested itself into malformations in the growing
feathers of the young birds. The team witnessed a phenomenon termed
'pallid bands' in a large proportion of fledgling Grasshopper Sparrows
and found spikes in the chemical signatures of 'pallid bands,' which led
to abnormalities in the new feathers.
"This may be the first example of severe thunderstorms being scientifically implicated in sub-lethal stress impacts on wildlife," says Jeremy Ross, who led the study at the Oklahoma Biological Survey, College of Arts and Sciences. Other co-collaborators on the study include Jeffrey F. Kelly and Eli S. Bridge, Oklahoma Biological Survey; Michael H. Engel, ConocoPhillips School of Geology and Geophysics; Dan L. Reinking, Sutton Avian Research Center; and W. Alice Boyle, Kansas State University.
https://www.sciencedaily.com/releases/2015/03/150303141736.htm
"This may be the first example of severe thunderstorms being scientifically implicated in sub-lethal stress impacts on wildlife," says Jeremy Ross, who led the study at the Oklahoma Biological Survey, College of Arts and Sciences. Other co-collaborators on the study include Jeffrey F. Kelly and Eli S. Bridge, Oklahoma Biological Survey; Michael H. Engel, ConocoPhillips School of Geology and Geophysics; Dan L. Reinking, Sutton Avian Research Center; and W. Alice Boyle, Kansas State University.
https://www.sciencedaily.com/releases/2015/03/150303141736.htm
Climate instability over the past 720,000 years
A new analysis of an ice core from Dome Fuji in Antarctica, along with
climate simulation results, shows a high degree of climate instability
(that is, rapid climate fluctuations) within glacial periods with
intermediate temperatures. This instability was attributed primarily to
global cooling caused by a reduced greenhouse effect.

Relationship between the frequency of climate fluctuations with temperatures in the Antarctic during the past 720,000 years obtained from analysis of Antarctic ice cores (black spots), as well as results for the final glacial period based on ice cores from Greenland (red squares). During the warm interglacial periods, and the coldest portion of a glacial period, the frequency of climate fluctuations was low, but during periods of intermediate temperatures within a glacial period, climate fluctuations occurred frequently and the climate was unstable.
https://www.sciencedaily.com/releases/2017/05/170502095125.htm
Relationship between the frequency of climate fluctuations with temperatures in the Antarctic during the past 720,000 years obtained from analysis of Antarctic ice cores (black spots), as well as results for the final glacial period based on ice cores from Greenland (red squares). During the warm interglacial periods, and the coldest portion of a glacial period, the frequency of climate fluctuations was low, but during periods of intermediate temperatures within a glacial period, climate fluctuations occurred frequently and the climate was unstable.
https://www.sciencedaily.com/releases/2017/05/170502095125.htm
How atmospheric waves radiate out of hurricanes
Researchers believe they have found a new way to monitor the intensity
and location of hurricanes from hundreds of miles away by detecting
atmospheric waves radiating from the centers of these powerful storms.

In a new study, scientists from the University of Miami (UM) Rosenstiel School of Marine and Atmospheric Science and the Hurricane Research Division of the National Oceanic and Atmospheric Administration (NOAA) presented direct observations of the waves, obtained by NOAA aircraft flying in hurricanes and by a research buoy located in the Pacific Ocean. The waves, known as atmospheric gravity waves, are produced by strong thunderstorms near the eye and radiate outward in expanding spirals.
"These very subtle waves can sometimes be seen in satellite images," said David Nolan, professor in the Department of Atmospheric Sciences, and lead author of the study. "We were able to measure them in aircraft data and surface instruments.
https://www.sciencedaily.com/releases/2017/05/170516090856.htm
In a new study, scientists from the University of Miami (UM) Rosenstiel School of Marine and Atmospheric Science and the Hurricane Research Division of the National Oceanic and Atmospheric Administration (NOAA) presented direct observations of the waves, obtained by NOAA aircraft flying in hurricanes and by a research buoy located in the Pacific Ocean. The waves, known as atmospheric gravity waves, are produced by strong thunderstorms near the eye and radiate outward in expanding spirals.
"These very subtle waves can sometimes be seen in satellite images," said David Nolan, professor in the Department of Atmospheric Sciences, and lead author of the study. "We were able to measure them in aircraft data and surface instruments.
https://www.sciencedaily.com/releases/2017/05/170516090856.htm
Space weather events linked to human activity
Human activities, like nuclear tests and radio transmissions, have been
changing near-Earth space and weather, and have created artificial
radiation belts, damaged satellites and induced auroras.

Our Cold War history is now offering scientists a chance to better understand the complex space system that surrounds us. Space weather -- which can include changes in Earth's magnetic environment -- are usually triggered by the sun's activity, but recently declassified data on high-altitude nuclear explosion tests have provided a new look at the mechansisms that set off perturbations in that magnetic system. Such information can help support NASA's efforts to protect satellites and astronauts from the natural radiation inherent in space.
https://www.sciencedaily.com/releases/2017/05/170517111618.htm
Our Cold War history is now offering scientists a chance to better understand the complex space system that surrounds us. Space weather -- which can include changes in Earth's magnetic environment -- are usually triggered by the sun's activity, but recently declassified data on high-altitude nuclear explosion tests have provided a new look at the mechansisms that set off perturbations in that magnetic system. Such information can help support NASA's efforts to protect satellites and astronauts from the natural radiation inherent in space.
https://www.sciencedaily.com/releases/2017/05/170517111618.htm
Earth's atmosphere more chemically reactive in cold climates
A Greenland ice core providing a first glimpse at the history of
reactive oxidants shows that for big temperature swings in the past
100,000 years, reactive oxidants are actually higher in cold climates.
This means that new mechanisms -- not just water vapor, plant and soil
emissions -- must affect the concentration of ozone and other oxidants
in the atmosphere.

Becky Alexander in the cold room of the UW's IsoLab with sections of an ice core. Her group is analyzing these samples from Antarctica to see if they show the same trend as the Greenland cores.
Becky Alexander in the cold room of the UW's IsoLab with sections of an ice core. Her group is analyzing these samples from Antarctica to see if they show the same trend as the Greenland cores.
Subscribe to:
Posts (Atom)