Saturday, October 1, 2016

10 weird things that have shown up on weather radar

1. Birds Trapped in Hurricane Hermine

The birds were detected using differential reflectivity from NOAA's Dual-Polarization radar. This particular radar feature can be used to detect non-meteorological radar echoes such as birds and insects, in addition to its normal precipitation detection function.
We've seen this occur one other time in recent years during another U.S. hurricane landfall. Birds were detected on radar in the eye of Arthur as it moved near the coast of North Carolina in 2014.

Base reflectivity (left) and Di        2. Mayfly Hatch


At some point during the summer every year, the Doppler radar at the NWS in La Crosse, Wisconsin, lights up with echoes, indicating that a mayfly hatch has occurred.
This happened most recently on the evening of July 26, 2016, where it usually does right along the Mississippi River near the Minnesota and Wisconsin border.  The mayflies often emerge in enormous numbers, allowing radar to detect them.
You can see the recent hatch in the image above in the green echoes from near the label for the city of La Crosse southward along the river.

3. The Bat Signal


    This image was posted by the National Weather Service (NWS) in San Antonio, Texas, on June 13, 2016 with a caption "The Bat Signal is strong tonight!"
    Each circle on the map shows an emerging bat colony detected by radar as they depart for the evening to feast on insects. This is a common summertime occurrence in central Texas.

    4. Swarming Termites

    The above image posted by the National Weather Service in New Orleans on the evening of May 29, 2016. In that radar image, termites can be seen swarming near the Big Easy, captured in the shades of dark blue and light green. The image was part of a radar loop that was posted to the NWS office's Twitter account.

    5. Birds Along Nebraska's Platte River

      This radar image from March 2, 2016, shows birds that were observed by radar along the Platte River in Nebraska. The birds are represented by the green and blue shadings near the red line, which is Interstate 80 along the Platte River in central Nebraska. Video taken the previous day verified the existence of a large number of sandhill cranes in the area, according to a Facebook post by the Rowe Sanctuary.

      6. Monarch Butterfly Migration

      (National Weather Service Reno, Nevada)
      The NWS office in Reno, Nevada, posted to Twitter on March 27, 2015, the radar image above that shows the spring migration of Monarch butterflies. These butterflies were spotted using a differential reflectivity scan, which is typically used to identify different types of precipitation, hail size and tornadic debris. As shown in the example above, it can also identify non-meteorological echoes such as birds and insects. In this case, the NWS says the differential reflectivity shows objects that are much wider than they are taller, or what you would expect from the body type of a butterfly.

      7. Birds Migrating

      Radar loop shows bird migration on April 12, 2012. Image credit: NOAA 
      Tom Niziol, winter weather expert at The Weather Channel, captured this radar image of migrating birds in western New York on the evening of April 12, 2012.
      Niziol says, "On the animation above I have penciled in what I describe as 'bird front' to outline the leading edge of the bird migration as it heads from the south shores of both Lakes Erie and Ontario across the water just after sunset."
      You can read Tom's full article on this subject here.

      8. Departing Train

      Radar Detection
      NWS El Paso captures train leaving on radar. 
      Watch closely. Now, watch it again. That brief red streak moving to the northwest is actually a train leaving a terminal. The NWS office in El Paso captured it on its radar.
      This is similar to how radar detected the interstate traffic earlier in this article.

      9. Military Exercises


      This image from the NWS office in Jacksonville, Florida, shows chaff in the narrow bands of green and blue radar echoes. Chaff are small pieces of aluminum which are released by military aircraft for self-defense to avoid radar detection.

      10. Wind Farm Interference

      Turbines from the Bulter Ridge wind farm in Wisconsin mess with radar data.(NWS Milwaukee/Sullivan)
      Energy created by wind farms can mess with radar results. The Butler Ridge wind farm west of Milwaukee is one example. According to NWS Milwaukee/Sullivan, turbines stretch about 400 feet into the air, and sit within the line of sight of the NWS doppler radar in Jefferson County, Wisconsin.
      "A small part of the electromagnetic energy radar beam sent from the radar is reflected back by the rotating turbines," the NWS said. "The radar processes this 'returned energy' as an area of precipitation and plots it accordingly on the map," which you can see circled in yellow.

      (Source - https://weather.com/science/news/radar-hermine-birds-eye)

      Drought affects apple harvest


      Amid the thick of apple picking season, several farms and producers throughout upstate Washington have suffered production setbacks due to unusual weather and drought over the past several months.
      It’s business as usual this time of year at Reisinger’s Apple Country in Watkins Glen as families, friends and coworkers come for one of fall’s time-honored traditions. However, the farm has taken a considerable hit to its apple yields.
      “For the early varieties, the yields have been down probably almost 50 percent,” owner Rick Reisinger said. “As we’re getting into the mid-season, the late-season ones. They’re all probably down 25 percent.”
      “It’s been a hot, dry year,” co-owner Karen Reisinger said.
      Rick Reisinger said while the excessively warm summer and drought have contributed to a reduced harvest, it was the cold spring that played a large part.
      (Source - http://www.the-leader.com/news/20160930/apples-among-crops-affected-by-weather-this-year)

      Death from a Hot Apple...Over Heated Big Apple

      Of course there are many predictions of how the rapid climate change will affect so many different aspects of our society and how we would have to learn and adapt to the new environment. As of now the major claims are those of oceans rising, harsher storms and longer and hotter summers. Speaking of longer hotter summers it is already a natural occurrence for people to die from heat exhaustion and or dehydration. The rate as of today particularly in New York City (The Big Apple) it averages around 600 heat related deaths per year.

      The issue with this is that now the summers are supposed to extend and they are projected to become hotter. The majority of those who die from heat exhaustion and other heat related deaths are the elderly population. With the climate changing this is projected to continue to rise every few years to at least reach 3,000 heat related deaths per year in 2080. 2080 may seem far away however the truth is this is going to shorten the life expectancy of those in this city due to severe high temperatures and most likely the shortage of fresh water (due to the melting of the ice caps and the frozen and ground water).

       Again, these are not definite numbers however it is possible that these type of related deaths, on top of other death reasons that already occur, could truly have a huge impact on the population in the next passing years post 2080.

      https://weather.com/safety/heat/news/new-york-city-heat-deaths-to-rise-by-2080

      By: Gabriel Evans

      Matthew's Collision Course with Cuba (Jamaica and Haiti)

      "Major Hurricane Matthew will pose severe risks to lives and property across Jamaica, eastern Cuba and Haiti by unleashing flooding rain, destructive winds and an inundating storm surge early next week.
      Matthew, currently a Category 4 (major) hurricane, will continue to slowly meander across the central Caribbean Sea before making an abrupt turn to the north later this weekend.
      That will put the major hurricane on a path to track over or dangerously close to Jamaica or Haiti before threatening to make a direct hit on eastern Cuba.
      "There is a potential for Matthew to bring devastating winds, a deadly storm surge and flooding rain to parts of Jamaica, far western Haiti and eastern Cuba," AccuWeather Meteorologist Mike Doll said.
      After moving away from the Caribbean, Matthew threatens to approach the US East Coast during the middle and latter half of next week...Based on the current forecast, most structures across eastern Jamaica and eastern Cuba will sustain some damage from the wind and weaker structures could be destroyed," Doll said.
      There will be sustained damaging winds in excess of 80 mph (130 km/h) with gusts over 100 mph (160 km/h). Widespread power outages, tree damage and flooding can also be expected...Conditions will become bad in Kingston, Jamaica, but the city should escape the worst impacts," Miller said. "I do not expect a significant storm surge based on our track, but there can still be sustained winds to 80 mph (130 km/h), gusts to 100 mph (160 km/h) and rain amounts of 5-10 inches (120-250 mm"

      As of now the Caribbean islands that are in danger are Jamaica and Haiti to sustain major damage depending on whether Matthew shifts westward (Jamaica) or eastward (Haiti). The major impact is projected for he Eastern half of Cuba then to continue on to some of the lower eastern states such as parts of Florida, Georgia and etc. It is currently at a category 4 and expected to lower to a 3 with the intact of some cooler water but it is not definite. Just hoping that all who are in the targeted areas are prepared for a pretty hard impact from Matthew coming in early this coming week.


      By: Gabriel Evans
      http://www.accuweather.com/en/weather-news/hurricane-matthew-to-lash-caribbean-with-flooding-damaging-winds-mudslides/60408827

      Record Flooding in Iowa

      "Heavy rain has led to record river flooding in northeastern Iowa, with several locations along the Cedar and Shell Rock Rivers either at or nearing all-time record high crests.
      Cedar Rapids, the state's second-largest city, is awaiting its turn as the big mass of floodwater surges downstream. With the Cedar River rapidly rising, the mayor of Cedar Rapids promised residents Friday that the city would not be caught "off guard" like it was during 2008 flooding.
      The river should crest at 25.3 feet on Monday — well below the June 2008 crest of 31 feet — but still the city's second-highest level on record, the National Weather Service said. Records go back to at least the early 1850s.
      Mayor Ron Corbett said there was still time for residents to protect their homes and businesses from flooding caused by the Cedar River, which is expected to crest sometime Monday.
      "We still have three days," he said. "We can save a lot in three days."
      More rain fell Thursday night and earlier Friday, and the weather service said the threat for flash flooding remained high through the day. Noting the possibility of even more rain in the area, forecasters said at least moderate flooding was likely in several areas.
      The town of Osage reached a record high crest Friday and the town of Shell Rock should reach a record high crest Saturday.
      In Cedar Rapids, Corbett said the community was better prepared for this week's flooding than it was in 2008, when flooding dislocated more than 18,000 people and caused more than $2 billion in damage to the city.
      "We were caught off guard a little bit last time," he said at a Friday morning news conference. "And this time we’re not."
      Portable dams, barriers and pumps were being deployed in Cedar Rapids. Though the water isn't expected to rise as high as in 2008, street flooding was expected in several areas, including the downtown core. The city said 14,000 sandbags have been ordered for public use and officials intend to close several low-lying roads.
      "We're very concerned about the downtown," said Mike Goldberg, director of Linn County Emergency Management.
      Elsewhere, authorities were spending Friday mobilizing resources to handle flooding that has already forced evacuations in several communities throughout northeastern Iowa.
      Cedar Falls officials have been talking to residents in low-lying neighborhoods about the rising waters and their option to evacuate. The dike system protecting downtown Cedar Falls was expected to hold, but Public Safety Director Jeff Olson said it will be patrolled. The weather service said the river was expected to crest at 99.8 feet Saturday afternoon — a little more than 2 feet below the record crest of 102.1 feet in June 2008."

      In essence, this article highlights that this year's flooding is coming dangerously close to the flooding that occurred roughly eight years today but is not expected to reach that high. However, the records dating back around 150 years are being broken by the recent height of the river. The majority this corn-raising state is being bombarded by levels of water that were not expected to return in such a short span, which in the past major flooding like this would occur within 10-20 years.

       
      By: Gabriel Evans


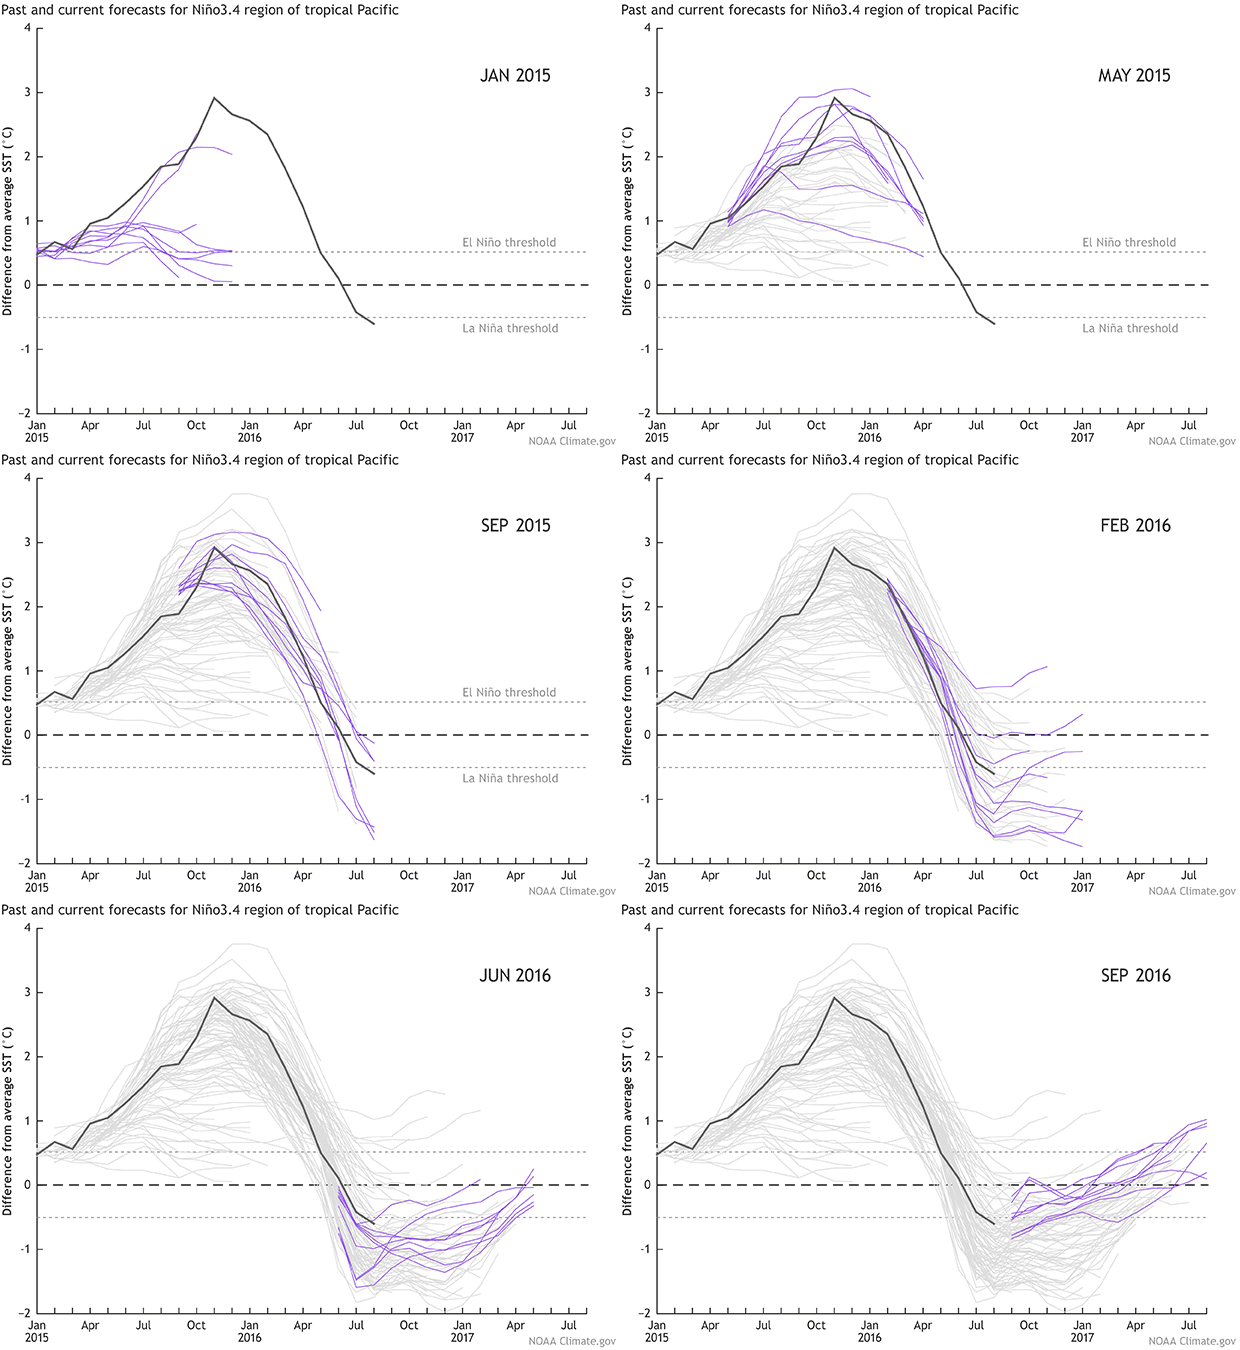
      Growth of the 2015-16 El Niño followed by the Incredible Shrinking La Niña forecast

      Growth of the 2015-16 El Niño followed by the Incredible Shrinking La Niña forecast

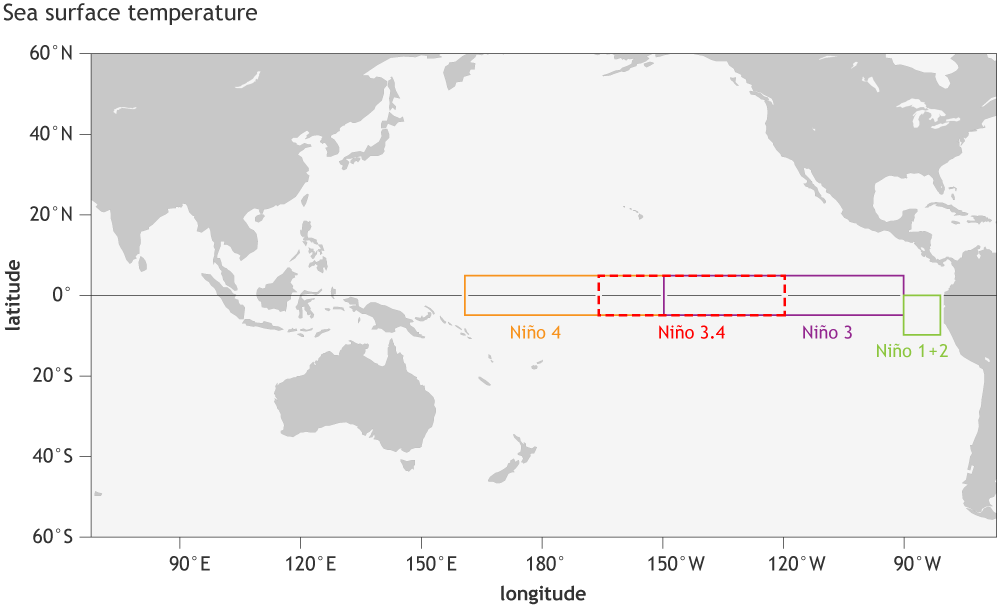
      This particular animation displays once-a-month data of sea surface temperature departures averaged in the Niño-3.4 region in the equatorial Pacific Ocean, which is one key location to monitor ENSO variations. Persistent positive numbers in excess of +0.5°C indicate El Niño, and persistent negative numbers less than -0.5°C indicate La Niña. 
      Black line:  these are the Niño-3.4 (ENSO) observations for each month starting in January 2015 and ending in August 2016
      Purple lines:  each line represents a forecast from a different model (1). There are 9 models shown in this animation, which are run at the beginning of each month (by the 6th-8th of each month) by various researchers and agencies across North America. The year and month in the upper right corner tells you when the model prediction was made. We like to examine different models because it is the forecasting equivalent of crowd sourcing. In climate prediction, no one model is clearly better than the rest, so this allows us to see the potential range of outcomes. 
      Grey lines:  Showing the past model forecasts dating back to January 2015 (2).  
      Okay, now watch it until the room spins—I mean just a few times—and I’ll point out some of the more interesting features below:


      animation of NMME forecasts of ENSO

      South Australia Falling Victim to Storms

      South Australia Falling Victim To Storms

      Southern Australia is becoming beckoned with water. The city of Port Pirie has been flooded. The town of Sevenhill has been warned of their dam weakening. Victoria, New South Wales, the ACT, Tasmania, and South Australia have all received severe weather warnings. The storm is reported to be one of the worst in 50 years. 80,000 lightning strikes have been reported with 22 transmission towers flying from the ground. 30,000 residents are without power, with the threat continuing in South Australia. Winds ranging from 50 to 140 km/hr have been reported. Sea levels have been reported to be slightly rising. Combining with the wind conditions shall result in coastal erosion and damage.

      http://www.news.com.au/technology/environment/almost-the-entire-south-east-corner-of-australia-under-severe-weather-warnings/news-story/093893a832c03638faa73981bc7c27e0