Showing posts with label David Hoff. Show all posts

Tuesday, December 8, 2015


The strong but complex storm system that brought snow to the west, heavy rains to the central US and major ice accumulations to western portions of the southern Plains is continuing to bring rain and snow to the Midwest as the main upper air Low now over the Rockies re-energizes the storm system during the next 24 hours. The storm and associated frontal boundaries will move eastward with most Precip moving off the east coast by Friday – with Temps continuing to average above normal across much of the nation. While there is still significant uncertainty on just how warm it will get across the eastern US going into next week, there are likely to be some record level warmth in the northern Mississippi Valley across to New England between late this week and the middle of next week. 

With little change in the primarily progressive upper air pattern anticipated, above normal Temps are likely to continue thru at least mid-month (and probably thru most of the month) across much of the nation). The exception to this outlook will be over portions of the inter-mountain west and Gulf coast state region where above normal Precip and below normal upper air heights will keep Temps closer to or even below normal. 

EL NIÑO PEAKS BUT IMPACT WILL CONTINUE THRU THE WINTER 

SST anomalies across the tropical EPAC have changed little over the past week, and remain near ‘Super El Niño’ levels in the benchmark 3.4 region where the latest weekly ONI update came in at +3.0˚C. With the MJO quite weak, and no major Westerly Wind Bursts forecast during the next 2 weeks, it appears likely that SST anomalies will gradually decrease during DEC to around +2.7˚C and closer to +2.0˚C by late JAN (unless, of course, all the operational and climate models are wrong). However, a solid El Niño atmospheric pattern is likely to persist thru the entire winter since there tends to be a significant lag in the atmospheric flow pattern response relative to changes in SST’s. 
http://www.wunderground.com/blog/SteveGregory/the-storm-that-keeps-on-going-with-unseasonable-warmth

This fall’s generally mild and dry pattern has continued with few disruptions through November, which is currently on track to easily set the record for Central Park’s warmest November. A brief cold surge in the wake of an anomalous November snowstorm in the Great Lakes will somewhat lower the monthly average temperature, but with a mild and generally dry pattern expected to resume through the remainder of the month, and likely through parts of December as a near-record strong El Nino continues in the Pacific Ocean.

 This is the first post on this blog in a month, the longest absence between posts in this blog’s nearly 6-year history. In addition to a significant work load outside of this blog, and a mostly uneventful weather pattern over the last few months, several long-planned changes for this blog will be implemented soon, both in terms of its mission and its design:

  • The blog will be significantly redesigned during late December and January. Preparation work has been done over the last month for a new visual design, which will split the blog into 3 primary pages: A home page featuring an overview of the latest forecast, a “Brief Outlook” page which offers a quick weekly outlook, and a “Detailed Analysis” page, where the more in-depth meteorological analysis will be posted.
  • As the blog statement in late August briefly noted, this blog will be shifting towards a more meteorology-oriented focus. Posts will be less frequent, but will feature more in-depth analyses on the recent and forecast weather patterns.
The 8-Day Forecast will continue to be updated, but less frequently than in past years, except for major weather events.

fall2015

More EL Nino News!

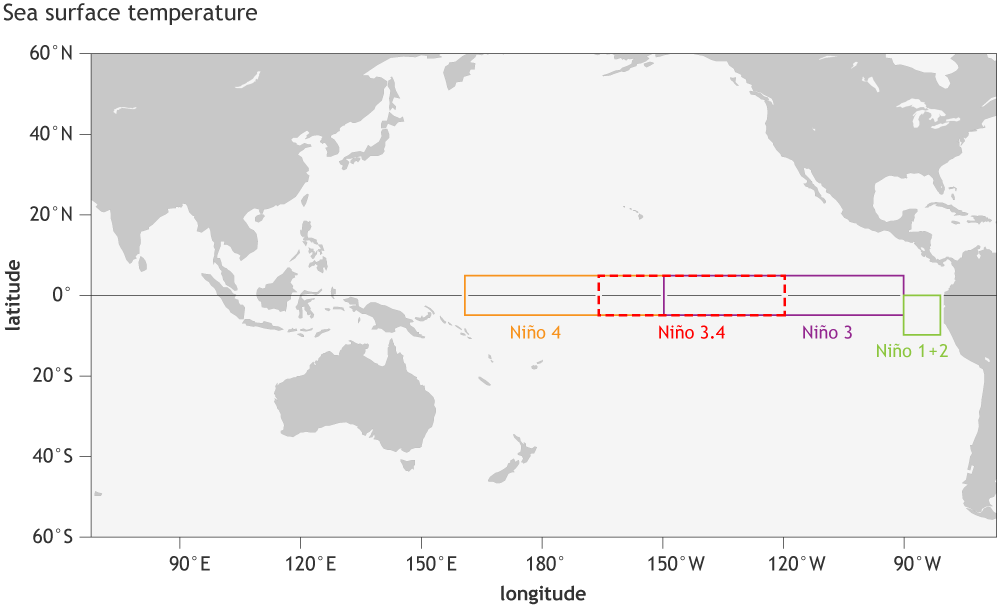
Incredibly warm waters continue to build across the equatorial Pacific, and the El Niño event of 2015 has just set a record for the warmest waters ever observed in the equatorial Pacific over a 1-week period. Sea-surface temperatures (SSTs) in the Pacific’s Niño3.4 region, between 90°W and 160°E longitude and 5° north/south latitude, are considered the benchmark for rating the strength of an El Niño event. The weekly departure of SST from average in this region hit +3.0°C (5.4°F) over the past week, NOAA announced in their November 16 El Niño update. This exceeds the previous 1-week record warmth in the equatorial Pacific of 2.8°C above average set during the week of November 26, 1997; accurate El Niño records extend back to 1950. However, the standard measure for the strength of an El Niño event is the three-month average Niño 3.4 SSTs, and the El Niño of 2015 is not yet officially considered the strongest on record. The August-September-October 2015 three-month average Niño 3.4 SSTs were 1.7°C above average, good for only the 2nd warmest on record, behind 1997. Judging from the trajectory of SST anomalies in Figure 1, though, it is likely that one of the late-year three-month average Niño 3.4 SST values in 2015 will end up upending 1997's record warmth and claim for the 2015 the title as strongest El Niño event on record. El Niño can't get much stronger than it is now, though, since there simply isn't enough warm water available in the Western Pacific to transport to the Eastern Pacific; wunderblogger Steve Gregory speculated in his Friday post that El Niño may now be peaking, and will begin a slow decline over the the next three months. Even so, El Niño will decline only gradually, and we can expect significant global impacts on weather during the coming winter. Below, I'll dive into some of the major non-U.S. impacts we can expect (and have already seen) from a strong El Niño; Bob Henson has covered the likely U.S. impacts in a number of previous posts, which are linked at the bottom of the blog.

http://www.wunderground.com/blog/JeffMasters/el-nio-of-2015-hits-alltime-record-strength-for-a-1week-period

More El Nino News

A strong El Niño continued during October as indicated by well above-average sea surface temperatures (SSTs) across the central and eastern equatorial Pacific Ocean (Fig. 1). Most Niño indices increased during the month, although the far eastern Niño-1+2 index decreased, accentuating the maximum in anomalous SST farther west (Fig. 2). The subsurface temperature anomalies also increased in the central and eastern Pacific, in association with another downwelling equatorial oceanic Kelvin wave (Figs. 3, 4). Low-level westerly wind anomalies and upper-level easterly wind anomalies continued over the western to east-central tropical Pacific. Also, the traditional and equatorial Southern Oscillation Index (SOI) values remained negative. These conditions are associated with enhanced convection over the central and eastern tropical Pacific and with suppressed convection over Indonesia (Fig. 5). Collectively, these atmospheric and oceanic anomalies reflect a strong and mature El Niño episode. Most models indicate that a strong El Niño will continue through the Northern Hemisphere winter 2015-16, followed by weakening and a transition to ENSO-neutral during the late spring or early summer (Fig. 6). The forecaster consensus remains nearly unchanged, with the expectation that this El Niño could rank among the top three strongest episodes as measured by the 3-month SST departures in the Niño 3.4 region going back to 1950. El Niño will likely peak during the Northern Hemisphere winter 2015-16, with a transition to ENSO-neutral anticipated during the late spring or early summer 2016 (click CPC/IRI consensus forecast for the chance of each outcome for each 3-month period). El Niño has already produced significant global impacts. El Niño is expected to affect temperature and precipitation patterns across the United States during the upcoming months (the 3-month seasonal outlook will be updated on Thursday November 19th). Seasonal outlooks generally favor belowaverage temperatures and above-median precipitation across the southern tier of the United States, and above-average temperatures and below-median precipitation over the northern tier of the United States. This discussion is a consolidated effort of the National Oceanic and Atmospheric Administration (NOAA), NOAA’s National Weather Service, and their funded institutions. Oceanic and atmospheric conditions are updated weekly on the Climate Prediction Center web site (El Niño/La Niña Current Conditions and Expert Discussions). Forecasts are also updated monthly in the Forecast Forum of CPC's Climate Diagnostics Bulletin. Additional perspectives and analysis are also available in an ENSO blog. The next ENSO Diagnostics Discussion is scheduled for 10 December 2015

http://www.cpc.ncep.noaa.gov/products/analysis_monitoring/enso_advisory/ensodisc.pdf
The peak of our current El Niño is expected to occur in the next month or so… but what does that mean? We measure El Niño events by how much warmer the surface waters in a specific region of the equatorial Pacific are, compared to their long-term average. The difference from average is known as the “anomaly,” and we use the average anomaly in the Niño3.4 region as our primary index for El Niño. When the index in this region is at its highest, we have our peak El Niño.
SST anomalies Oct 2015
Average sea surface temperature departure from the 1981-2010 average over the four weeks ending on November 7. Graphic by climate.gov, data from NCEP-NCAR reanalysis.
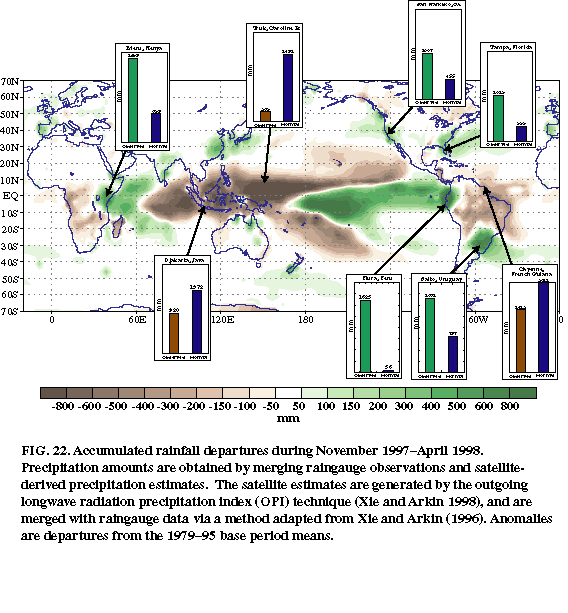
However, El Niño-related impacts have been occurring around the globe for months already, and will continue for several months after the warmest temperatures occur in the tropical Pacific Ocean. For example, during the 1997-98 El Niño, the Niño3.4 Index peaked at 2.33°C in November (using ERSSTv4 data, the official dataset for measuring El Niño), and the most substantial U.S. effects occurred through the early spring of 1998. A bit later in this post, we’ll take a look at what’s been going on so far this year.
https://www.climate.gov/news-features/blogs/enso/november-el-ni%C3%B1o-update-it%E2%80%99s-small-world
Forget enjoying a pumpkin spice latte if you live in the eastern half of the U.S. Cold brew weather is coming back to the region to start November, including record warmth in Florida to kick off the week.
A strong ridge of high pressure is building in eastern Canada and will effectively block colder air from coming into the region.
That will allow near-record warmth to bake most locations east of the Mississippi with temperatures more like September than November. Highs will be 10-15°F above normal from Chicago to New York, reaching into the 70s this week. The warmest location compared to normal goes to Iowa on Monday. Temperatures are also in the 70s there and in some locations, that’s more than 20°F above normal.
Daily U.S. temperature anomalies
Temperatures anomalies forecast for North America this Wednesday
Locations to the south will be even warmer, including Florida. Tallahassee has already set a record on Sunday with the mercury cracking 88°F. It’s headed that way again on Monday and other locations across the state could also see records.
The reason for the widespread eastern warmth? You may be tempted to blame El Niño. Don’t. In fact, the odds usually increase for cooler temperatures in the South during El Niño while the Midwest doesn’t see strong El Niño impacts one way or the other.
Instead, other atmospheric factors are at play. That includes the Arctic Oscillation, a pattern of winds over the northerly reaches of the globe, which is positive. When the Arctic Oscillation is positive, it tends to keep cold air away from the eastern U.S.
http://wxshift.com/news/november-more-like-september-as-warm-weather-toasts-eastern-us
Synopsis – We have started to see the usual, seasonal increase in the speed of the midlatitude westerlies.  Except in southern California, storms that look interesting in the forecast model simulations weaken as they reach the coast due to the lack of ability to find energy as they approach the coast.  TheEl Niño anomaly is starting to provide enough energy to force troughing over southern California, Baja, and Arizona. However, a robust connection between the subtropical and midlatitude westerlies has not yet occurred.
In the Near-Term - Southern California Avocado Area 10/29 to 11/15…   Recurrent troughing will continue near or over southern California accompanied by a weak southern branch of the westerlies. The latest guidance does not suggest the development of the southern storm track beyond its current intensity, and the longwave trough is starting to focus into Arizona. Showers are possible from frontal remnants in November on the 2nd and 3rd, the 5th, the 10th, and the 13th to 15th.
http://www.californiaavocadogrowers.com/articles/30-day-weather-outlook-october-26-2015-november-26-2015
the active Western Disturbance is now lying over Jammu and Kashmir and adjoining areas. While, an induced cyclonic circulation from this system is over northwest Rajasthan and adjoining areas. With this, good rain and snow will continue over Jammu and Kashmir and parts of Himachal Pradesh on Monday. While, rain and thundershowers are likely over Punjab and Haryana. Isolated activity is expected over Delhi also.
Series of cyclonic circulations continue to persist. One is seen over south Andaman Sea. While, another cyclonic circulation is over East Sri Lanka. Third cyclonic circulation can be seen over southwest and adjoining southeast Arabian Sea.
All the systems will bring light to moderate rain over Kerala and south Tamil Nadu on Monday.
Scattered light rain may also occur over southwest Madhya Pradesh and South Madhya Maharashtra.
Northeast region will also continue with isolated rain and thundershowers.
Weather will remain dry over rest of the country that includes entire Central and East India.
http://www.skymetweather.com/content/national-video/weather-forecast-for-october-26-2015-skymet-weather/

October Temps

  • The October average temperature across global land and ocean surfaces was 1.76°F (0.98°C) above the 20th century average. This was the highest for October on record, surpassing the previous record set last year by 0.36°F (0.20°C), and marked the sixth consecutive month a monthly global temperature record has been broken. This record departure from average was also the highest on record for any month, surpassing the previous record set last month by 0.13°F (0.07°C).
  • The October globally-averaged land surface temperature was 2.39°F (1.33°C) above the 20th century average. This was the highest for October in the 1880–2015 record, surpassing the previous record set in October 2011 by 0.31°F (0.17°C).
  • The October globally-averaged sea surface temperature was 1.53°F (0.85°C) above the 20th century average. This was the highest temperature for October in the 1880–2015 record surpassing the previous record set last year by 0.27°F (0.15°C). This was also the highest departure from average for any of the 1630 months of recordkeeping, surpassing the previous record set last month by 0.07°F (0.04°C).
  • The average Arctic sea ice extent for October 2015 was 460,000 square miles (13.4 percent) below the 1981–2010 average. This was the sixth smallest October extent since records began in 1979, according to analysis by the National Snow and Ice Data Center using data from NOAA and NASA.
  • Antarctic sea ice extent during October 2015 was 90,000 square miles (1.3 percent) below the 1981–2010 average. This was the 14thlargest Antarctic sea ice extent on record. On October 6th, the Antarctic sea ice extent reached its annual maximum extent at 7.24 million square miles, slightly above average and in contrast to the past three years when record large maximum sea ice extents were observed.
https://www.ncdc.noaa.gov/sotc/
October 2015 Selected Climate Anomalies and Events MapOctober Blended Land and Sea Surface Temperature Percentiles
The two maps on the right are current SST, the left side is 1997 on this date and 2002 (lower left).  You can see one significant difference in this year…warmer ocean temps across the northeast Pacific.  The Blob might look a bit different, but temps are still well above normal for most areas offshore and it sure hasn’t died at all.
By the way, WeatherBell charges about $180/year for this site…worth every penny (boss pays for it) in this business.  No, they don’t give me free access for tooting their horn.
El Nino is currently in the STRONG category with the weekly ONI index at 2.4 as of today.  The highest 3-month running average is 2.3, set during the 1997 event.  You can check out the values here.  There is a weekly update at this link out every Monday morning.
So now we wait and see what this event brings.  I think it’s obvious we are guaranteed a very mild winter, but two big questions:
  1.  Will it be a “wet event” like 82-83 and 97-98?  Or a “dry event” like 91-92, 02-03?  Gut feeling is that it’ll be the former.  Plenty of precip mixed in with lots of dead periods.
  2. Will we get some sort of snow/ice event?  It only takes one “backdoor arctic blast” through the Gorge and then returning moisture to give us a storm in the metro area.  So the pattern has to only be just right for less than a week to give us something memorable…like January 1998.
The national September stats are out from NCDC…and…it was a NORMAL MONTH!  Yes, we didn’t have a hot September, we didn’t have extra warm nights, we weren’t chilly.  Just slightly below average rainfall.  Otherwise a very pleasant month…that was nice:
201509 (1)
https://fox12weather.wordpress.com/2015/10/12/
In lieu of direct impact from Hurricane Joaquin, what led to historic rainfall in the Carolinas this past weekend?
According to AccuWeather Chief Meteorologist Elliot Abrams, "I have never seen rainfall this intense, in this large of an area and during this short of a period in absence of direct impact from a tropical storm or hurricane."
From 1 to 2 feet of rain has fallen over a broad area in the Carolinas, over a span of three to four days.
A very unusual combination of weather factors came together in just the right way to produce rainfall rates rarely experienced and total rainfall never precisely recorded before in part of the Southern United States.
Weather Setup for Historic Carolina Flooding
The setup not only disrupted travel and drenched ballgames in the East but also resulted in major flooding in some locations.
The key players included a strengthening non-tropical storm in the South, a strong area of high pressure in Canada and converging tropical moisture from Hurricane Joaquin and near the equator.
http://www.accuweather.com/en/weather-news/what-factors-caused-historic-deadly-south-carolina-flooding-joaquin-tropical-moisture/52795370
Three weather features helped set the stage for some of the worst coastal flooding the region has seen since Hurricane Sandy in 2012. The first feature was Hurricane Joaquin. Joaquin evolved from a non-tropical low into a tropical depression on September 28, southwest of Bermuda. Joaquin then became a tropical storm on September 29, drifting slowly southwestward toward the Bahamas. Joaquin then underwent rapid intensification, reaching hurricane strength on September 30 and major hurricane (Cat 3) status on October 1. Against numerical guidance solutions, Joaquin continued to drift slowly to the southwest, before finally beginning to curve back to the north on October 2. On October 3, Joaquin began to increase forward speed, intensifying to Category 5 strength, acquiring sustained winds of 155 mph. This made Joaquin the strongest Atlantic hurricane since Hurricane Igor in 2010. The storms central pressure bottomed out at 931mb around 00z on October 2. Joaquin weakened, but remained a hurricane on October 4, passing well off the Mid-Atlantic Coast through October 6. While numerical and statistical guidance performed poorly with the track of Joaquin, this review will focus more on the impact of coastal flooding and not on Joaquin's track.
The second feature was a cold front that swept across the Mid-Atlantic region the evening of September 30. The front then stalled just off the Mid-Atlantic coast on October 1, and remained along to just offshore through October 6. Height falls from a deepening eastern CONUS trough produced an area of low pressure off the SC coast, which provided the focus for an extreme rainfall event across the Carolinas. It wasn't until Hurricane Joaquin lifted well offshore that the front finally began to push well offshore. The front provided a focus, when coupled with prolonged onshore flow, for a prolonged period of cloudy and wet weather. Norfolk and Elizabeth City recorded 6 and 7 days of rainfall, respectively. Numerical and statistical guidance also struggled with rainfall amounts across the region, with as much as 7 to 10 inches forecast early in the event. Precipitation totals ended up in the 1 to 3 inch range inland and 3 to 6 inches in southeast Virginia. The highest amounts were recorded in Isle of Wight County and the Peninsula, where amounts up to 10 inches were reported. Heavy rainfall exacerbated the coastal flooding during periods of high tide. Numerous days of cloudy and wet weather also resulted in significant crop damage.
http://www.weather.gov/akq/CoastalStormOct2015
Weather Map
ENSO Forecast

Today we compare the NOAA and JAMSTEC forecast through March - April - May 2016. The JAMSTEC forecast for CONUS is colder and wetter than NOAA's forecast. The JAMSTEC information identifies areas of the World with significant deviations from climatology (normal). Whether or not the actual weather works out as either of these forecasts suggests is an open question. Over the next two weeks, the NOAA forecast has, according to NOAA a low level of confidence and the analog analysis in this report suggests why.

This is the Regular Edition of my weekly Weather and Climate Update Report. Additional information can be found here on Page II of the Global Economic IntersectionWeather and Climate Report.
NOAA issued an updated Seasonal Outlook on September 17. The JAMSTEC (Japanese) analysis is also available. Let us compare them.
First let's take look at the ONI forecasts which is the most widely available measure of the strength of an El Nino (or La Nina) and is the deviation of the sea surface temperature from climatology (normal) in a small part of the Eastern Pacific along the Equator considered to be the best place to assess the strength of an ENSO phase whether it be El Nino, ENSO Neutral, or La Nina.
First the NOAA forecast of conditions in the Nino 3.4 area which defines the ONI Index
http://econintersect.com/pages/weather/weather.php?post=201509280038

SUPEr Blood Moon

The total lunar eclipse of September 28, 2015 is preceded two weeks earlier by a partial solar eclipse on September 13 and will be visible from the eastern Pacific, North and South America, Europe, Africa and western Asia.
According to NASA's eclipse specialist Fred Espenak, the Moon will be totally eclipsed (totality) for 1 hour and 11 minutes, but the instant of greatest eclipse takes place at 02:47 UTC.
In the US, this is 22:47 EDT, 21:47 CDT, 19:47 PDT on September 27. In Europe, Middle East, Asia and Australia: 03:47 BST, 04:47 CET, 05:47 AST, 09:47 ICT, 12:47 AEST... on September 28.
http://thewatchers.adorraeli.com/2015/08/31/supermoon-lunar-eclipse-on-september-28-2015-ends-the-current-lunar-tetrad-blood-moon/
The current buzz in cafes across California is that snow from this year’s big El Niño will bring the best skiing in years. What fortunate skiers don’t realize is that the same periodic ocean-atmosphere interaction in the Pacific Ocean is one of the most devastating natural forces on Earth, endangering the wellbeing of over three billion people across the tropics. El Niño creates winners and losers on a global scale. Each year is like planetary roulette, and the current forecast is for families in the tropics to suffer in the coming months.
The last time a really large El Niño occurred was during the Northern Hemisphere’s winter of 1997-98. Droughts, floods and outbreaks of infectious diseases plagued villages across Africa. Floods inundated Peru. Megafires rampaged through Indonesia. Fisheries collapsed off the coast of South America. Crops failed across much of the tropics and global food prices rose. Civil conflictsbroke out in Africa and Asia.
Today, in all likelihood, we stand about a month away from another major El Niño. Current state-of-the-art forecasts tell us that an event similar to 1997-98 is likely to return this winter. Our own research on the human toll of El Niño suggests that households in the tropics will begin to feel the heat as early as September.
http://www.theguardian.com/commentisfree/2015/sep/21/el-nino-weather-save-california-destroy-tropics
There are a couple of notable things this month. First, NINO3.4 region sea surface temperature anomalies, which NOAA uses as its primary metric for determining the strength of an El Niño, are still running a tick ahead of the 1997/98 El Niño. Considering the volume of warm water below the surface of the central and eastern equatorial Pacific, we shouldn’t expect the El Niño to decay anytime soon. See the NOAA animation of subsurface temperature anomalies through September 15 here. In fact, we may expect the NINO1+2 region to warm again.
Second, for the first time in a few months I can report that there appears NOT to have been another westerly wind burst in the western tropical Pacific recently. If Mother Nature wants the El Niño to continue strengthen, she’ll continue to provide westerly wind bursts in the western equatorial Pacific.
ENSO METRIC UPDATES
This post provides an update on the progress of the evolution of the 2015/16 El Niño (assuming one continues into next year) with monthly data through the end of August 2015, and for the weekly data through mid-September. The post is similar in layout to the updates that were part of the 2014/15 El Niño series of posts here. The remainder of the post includes 17 illustrations so it might take a few moments to load on your browser. Please click on the illustrations to enlarge them.
Included are updates of the weekly sea surface temperature anomalies for the four most-often-used NINO regions. Also included are a couple of graphs of the monthly BOM Southern-Oscillation Index (SOI) and the NOAA Multivariate ENSO Index (MEI).
For the comparison graphs we’re using the El Niño evolution years of 1997 and 2014 (a very strong El Niño and the last El Niño) as references for 2015. The 1997/98 El Niño was extremely strong, while the 2014/15 event was extremely weak and intermittent.
Also included in this post are evolution comparisons using warm water volume anomalies and depth-averaged temperature anomalies from the NOAA TOA project website.
Then, we’ll take a look at a number of Hovmoller diagrams comparing the progress so far this year to what happened in both 1997 and 2014.
Last, we’ll compare maps and cross sections (2014 and 2015) from the GODAS website of a number of ENSO-related metrics.
http://wattsupwiththat.com/2015/09/21/september-2015-enso-update-sea-surface-temperatures-continue-to-rise-in-the-central-equatorial-pacific/01 NINO Time Series
It's been a slow six weeks around here, with sparse delivery of State of the Atmospheres recently as the state has been rather predictable: clear, warm, and calm.
The start to September for the eastern two thirds of United States has been a hot one, and not surprisingly, Denver is currently running several degrees above normal for the month. Officially, the temperature is running 4.2° F above average through the first 13 days of the month.


Many of the analogs Brian Bledsoe discussed recently in his article on the CPC constructed analogs also featured very warm Septembers, especially for the eastern two thirds of the United States. Let's consider three of these analogs: 2002, 1997, and 1941 which combined produced a composite standardized temperature anomaly map which looks a lot like this month
http://www.weather5280.com/blog/2015/09/14/the-state-of-the-atmosphere-monday-september-14-2015/NOAA/NCDC divisional climate data | Temperatures
If you ask an astronomer when summer ends, they'll tell you "September 23." That is the date of the autumnal equinox, the date when the day and night are approximately equal in length (the day is always a couple minutes longer because the sun does not set all at once and therefore radiates light until the very last part of it has set below the horizon). Ask a meteorologist though, and they'll tell you that autumn begins September 1, as that is the beginning of 'meteorological autumn,' which goes until November 30. During this time period, our nights get longer while our days get shorter, our daytime and nighttime temperatures plummet, stronger storms start to enter the region, and people become more and more obsessed with the Seahawks. Our earliest lowland snows have generally appeared the last two weeks of November, and our stormiest week is Thanksgiving week. I will have an exclusive winter 2015-2016 forecast on WeatherOn that will be released November 1, so be on the lookout for that. For now, I thought I'd give a more informal autumn forecast.

This has been one of the more abrupt summer-to-fall transitions that I can remember. June and July both broke their respective all-time average temperature records and were extremely dry as well, while August was our 4th wettest month on record and was capped off by a historic windstorm at the end of the month.  Now, it's mid-September, and we are still seeing cooler temps and showers.

We've gone from a pattern of persistent ridging directly over our area to one of persistent troughing, with the ridge having retrograded much further west. Now, storm systems and "shortwave troughs" are undulating on the east side of this ridge and sliding down from the northwest into our area, giving us cooler temperatures and precipitation than anything we experienced during June, July, and even much of August.
http://www.weatheron.net/#!El-Ni%C3%B1o-Strengthens-As-Fall-Arrives/cmbz/55fb7c280cf25fa7fe0f9548
The cumulative rainfall deficiency now stands at 13%. But, 53% of the total area of India has received normal rains so far.
The western disturbance as an upper air trough over Afghanistan and adjoining North Pakistan will bring scattered rains over the hills of North India.
The Monsoon trough will continue to run closer to the foothills of the Himalayas up to Northeast India. The plains of North India will remain mostly clear and dry. Morning hours will be quite pleasant. Another reason to not skip the early morning jog tomorrow.
The cyclonic circulation over Assam will be seen as an upper air trough extending from West Assam to Northeast Bay of Bengal across Bangladesh. Accordingly, scattered light rains likely over Sub-Himalayan West Bengal and the Northeastern states.
A trough can be seen extending from Telangana up to Lakshadweep across Karnataka. Due to this system fairly widespread rainfall likely over South Interior Karnataka and adjoining areas. Scattered rains likely over Telangana, Rayalaseema, North Karnataka, North Tamil Nadu, Marathwada and Kerala. Vidarbha and Madhya Maharashtra will also receive some rainfall.
Light rainfall likely over parts of Madhya Pradesh, Chhattisgarh, Jharkhand, Southeast Rajasthan and Gangetic plains. This could be due to localized activities like rise in temperatures and humidity levels.
http://www.skymetweather.com/content/national-video/weather-forecast-for-september-7-2015-skymet-weather/

September Heat

Hot weather appears to be heading into Michigan late next week. In fact, when looking at next Thursday, Sept. 3, it could be the hottest temperatures on that date since 1953.
The heat won't be a flash in the pan. Most indications are temperatures around 90 degrees or warmer will stretch from next Thursday, Sept. 3, right through Sunday, Sept. 7.
All of the weather data has been consistently showing hot temperatures for the second half of next week. The first graphic above shows the projected high temperature from our U.S. computer model called the GFS. It's the coolest of the models we look at. The European Medium Range Model (Euro) is even hotter, warming many spots into the mid-90s next Thursday.
The 6-10 day and 8-14 day temperature forecasts take us to Sept. 9. There is no end in sight to the heat through the first nine days of September.
http://www.mlive.com/weather/index.ssf/2015/08/hottest_early_september_temps.html