Tuesday, March 31, 2015

New Study On How Global Warming Changes The Weather

Human caused greenhouse gas pollution has warmed the planet. Global warming means more extreme weather. Many meteorologist who watch the weather every day see this. More and more research shows that greenhouse gas pollution changes the weather in a way that causes even more change in the weather. Changing weather systems means more lightning, increased high precipitation events in certain regions like the US Northeast, including more frequent large snow storms.

Global warming has had uneven effects. The Arctic has warmed relatively more than most of the rest of the planet. The major movements of air masses are driven by a combination of the rotation of the Earth and the movement of extra heat from the Equator towards the poles, a process that sets up the trade winds and the jet stream. But the additional warming in the Arctic has changed this pattern measurably, resulting in these and other changes in weather patterns.

Read more here: http://scienceblogs.com/gregladen/2015/03/12/new-study-on-how-global-warming-changes-the-weather/

Record Heat Coming Up in the West of 100 Degrees

The hottest weather so far this year has arrived in the West and will continue through early this week in the Southwest. Last Thursday brought the year's first triple-digit temperature reading anywhere in the country when Death Valley, California, logged an official high of 101 degrees. Death Valley topped out a degree higher at 102 degrees on both Saturday and Sunday. On Monday, the high was 103 degrees, which ties the all-time record high there for the month of March. In Arizona, Phoenix clocked its fourth consecutive day in a row with high temperatures above 95 degrees on Monday. This is the earliest that this has happened there since records began in 1895.
A ridge of high pressure is responsible for the record warm temperatures that we have seen in the West. While generally above-average temperatures will persist in the Southwest early this week, a Pacific cold front and an attendant southward dip in the jet stream should knock temperatures back at least to seasonal averages in the Northwest, northern Rockies and northern Great Basin by Tuesday.
Link:http://www.weather.com/forecast/national/news/record-warm-march-west


Forecast Highs Next Three Days

Spring Temperatures Return to the Midwest

After months of brutal cold, and weeks of teasing temperature roller coasters, a welcomed spring warm up is developing in the Midwest and the Northeast this week.As the week continues, the jet stream will lift northward in the central and eastern states, allowing some warmer air to spread from the Plains into the rest of the Midwest and Northeast.
According to the latest April temperature forecast from Weather Services International (WSI), there are signs that milder temperatures may dominate overall in the Midwest and Plains for the rest of the month, while the Northeast may not be so lucky. Below is a look at what you can expect from the warm up this week, plus April's temperature forecast for the Lower 48 states.
Initially, the Midwest will see the benefits of this pattern change with a northward bulge in the jet stream spreading eastward from out of the West. As a result, warmer-than-average temperatures will engulf the Midwest from west-to-east through Thursday. Thunderstorms, possibly severe, may also accompany the warmer temperatures by midweek. Daytime highs will be as much as 25 degrees warmer than average, particularly in the Plains and Upper Midwest through Wednesday. Highs will soar into the 60s, 70s and 80s at times early in the week across the Midwest.
Link:http://www.weather.com/forecast/national/news/spring-temperatures-return-welcome-warm-up-for-midwest-northeast

Midwest Forecast

Large Hail in Arkansas Mid-Monday

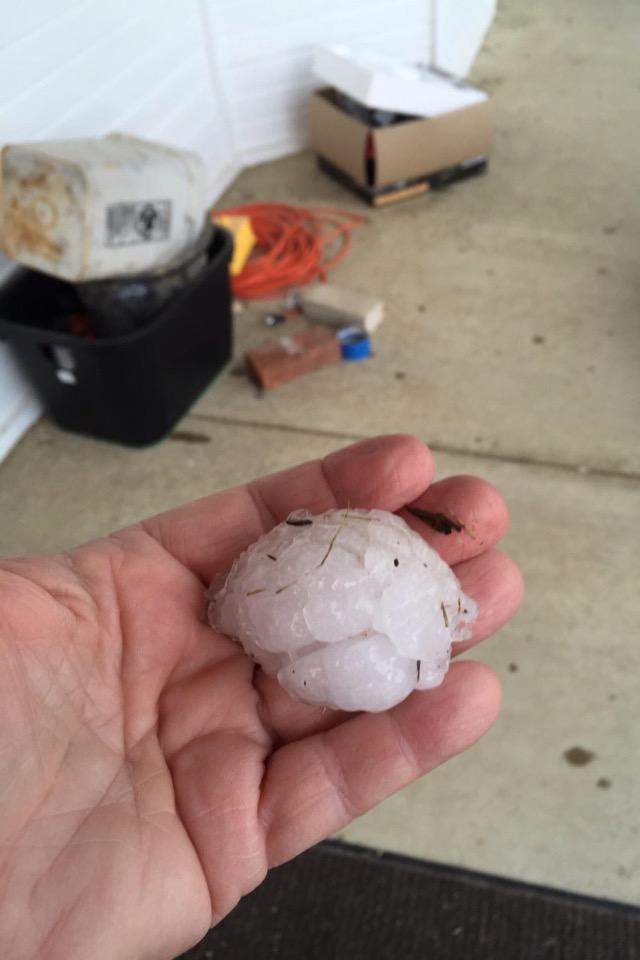
Severe weather is underway in the Mid-South, dumping large hail on parts of Arkansas Monday afternoon.Hail the size of golf balls and slightly larger was reported by storm spotters in towns near Little Rock on Monday. There were no immediate reports of damage or injuries from the storms.

"Weak disturbances are moving across the South, where sufficient moisture is in place for the development of thunderstorms capable of producing large hail and localized damaging wind gusts," said weather.com meteorologist Chris Dolce. "This threat through Tuesday evening will be along a west-to-east swath from southern Oklahoma and northern Texas to Georgia. Additional severe storms are possible in parts of the Plains, Midwest and South through Friday."

Link:http://www.weather.com/storms/severe/news/severe-weather-midsouth-southeast

View image on Twitter

Super Typhoon Maysak Threatens The Philippines

Super Typhoon Maysak has rapidly intensified since Monday and is the equivalent of a Category 5 hurricane, according to the Wednesday morning advisory issued by the National Weather Service in Guam (Guam is 14 hours ahead of U.S. Eastern daylight time).
Maysak now packs estimated maximum sustained winds of 160 mph, becoming only the third super typhoon in reliable records dating to the 1940s with estimated winds that strong prior to April 1, according to Weather Underground's Dr. Jeff Masters.
Maysak is also only the fifth super typhoon of record prior to April 1, according to senior digital meteorologist, Nick Wiltgen. A western Pacific tropical cyclone is named a "super typhoon" when maximum sustained winds reach 150 mph. The last such pre-April super typhoon was Super Typhoon Mitag in March 2002.

The eye of Maysak was moving westward to the north of Yap Island (population ~ 11,000) as of early Wednesday morning, local time. This should keep the most violent winds from Maysak just to north of Yap. That said, typhoon-force winds up to 75 mph are possible in the Yap Islands as Maysak makes its closest approach Wednesday morning. Coastal inundation of 4-6 feet is possible along windward shorelines of the Yap Islands. Rainfall flooding is also likely in poor-drainage and low-lying areas.

Link:http://www.weather.com/storms/typhoon/news/typhoon-maysak-yap-philippines-pacific

Infrared Satellite: Maysak

Amazing Roll and Asperatus Clouds Appear Over Augusta, Georgia, and South Carolina


http://www.weather.com/science/weather-explainers/news/roll-asperatus-clouds-augusta-georgia-south-carolina

The choatic, wavy canopy of clouds is known as asperatus undulatus, Latin for "agitated waves."
This cloud species, not yet officially recognized by the World Meteorological Organization, is sometimes seen after a thunderstorm's gust front has passed you. 
Ahead of either a single thunderstorm or line of storms, you may first experience a strong gust of wind, which denotes the gust front.  Look skyward – from a safe place in a thunderstorm, that is – and you may see these undulatus asperatus clouds. 
Similar to lenticular clouds, what you're seeing is turbulent wave motion. According to Graeme Anderson, from the Department of Meteorology at Reading University, winds at cloud level lead to sufficient wind shear to produce the wavy motion.
This wavelike motion akin to flapping one end of a blanket or bed sheet up and down can be seen most demonstrably in a timelapse of undulatus asperatus, such as what was captured by the National Weather Service in Columbia, South Carolina, on Monday morning.

Midweek Severe Thunderstorm Threat

This week ahead of us, rain and thunderstorms are reported to become more common in parts of the South as moisture returns northward. On Wednesday, portions of the Midwest could be targeted by severe thunderstorms as a cold front pushes through the region. However, the magnitude of the severe threat remains uncertain which is why it would be wise to stay tuned into the news for day to day updates. A few light storms (some involving hail) have already occurred in the southern Plains from southeast Oklahoma to central and southern Arkansas, as well as northeast Texas and northwest Mississippi. The image attached shows the forecast for a severe threat that the Midwest may encounter sometime midweek. As you can see, Chicago may be due for some T-storms or rainfall.


http://www.weather.com/storms/tornado/news/severe-weather-tracker-page

The West Coast Is in Hot Water

Move over polar bears. Are starving sea lion pups the new face of climate change?
This year’s slew of hungry pups washing ashore in California, which has generated a slew of media coverage replete with heart-tugging images, has roots in natural temperature fluctuations in the ocean. But in the coming decades, human-induced warming could make these types of conditions more common. And sea lion pups are just the tip of a larger shift in the Pacific and the rest of the world’s oceans if human emissions continue to warm the planet. In recent weeks, emaciated young sea lions have been washing up on California beaches. Roughly 1,800 stranded pups have been found on California beaches through the first two-and-a-half months of 2015. That’s well above the 100 or so that usually turn up through the end of March and “at least as high as anything in the historical record,” according to Nate Mantua, a scientist at the Southwest Fisheries Science Center in La Jolla, Calif.
In 2013 and 2014, large numbers of disheveled sea lion pups were also stranded on California’s beaches, though not at the same levels as this year. One of the main causes has been the unusual and in some cases, record setting — warm water off the West Coast of the U.S. and stretching all the way to the Gulf of Alaska. The warm water is less rich in nutrients and the types of microscopic organisms and fish upon which sea lions usually feed. That has forced sea lion moms and pups alike to forage further for food, a tiring proposition for young sea lions. While the sea lions have been the face of the recent intrusion of warm water, ecosystem disruptions are visible throughout the stretch of the eastern Pacific and Gulf of Alaska. Cold water copepods — small crustaceans at the base of the food chain — populations have dropped off sharply in the past year, while their warm water (less nutritious) brethren have shown up in huge quantities.
Further up the food chain, skipjack tuna have turned up in Alaska, thousands of miles beyond their usual range and Mantua said, “sportfish like marlin — things people travel to fish for in Baja — they’re catching them for day trips in southern California.”The warm water in the eastern Pacific over the past two years is a harbinger of things to come for the region. Ocean temperatures have been rising around the world and are expected to keep warming, and the eastern Pacific could see the odd conditions of the past two years become commonplace by mid-century. Just how far-reaching the impacts will be and which species will adapt and which will fail to is something scientists are still trying to untangle.


http://www.weather.com/science/environment/news/west-coast-hot-water-rising-temperatures-climate-change


Hawaii's Coastlines Will Erode Twice As Fast By 2050, Study Says

Hawaii's majestic coastline has always been molded by the sea, but a new study found a reason to be concerned about our 50th state's pristine beaches.
Scientists at the University of Hawaii's School of Ocean and Earth Sciences and Technology recently released a study that found some of the island state's beaches will be reduced by as much as 20 feet by 2050 and 40 feet by 2100 due to erosion. Their findings were published this week in the journal Natural Hazards.
The scientists came to their conclusions after studying 10 Hawaiian beaches on the islands of Oahu, Maui and Kauai. Of the three islands studied, Maui has the highest rate of erosion, with 85 percent of beaches affected. "Over a century of building along the Hawaiian shoreline, without this sort of detailed knowledge about shoreline change, has led to some development that is located too close to the ocean," said Dr. Charles Fletcher, UH Geology and Geophysics Professor and lead author of the study, in a USGS report." This is especially troubling, the university's Coastal Geology Group said, because building a seawall would actually accelerate the speed of erosion, so it isn't an option for the Hawaiian coastline.
There are multiple reasons why the state's coastline is eroding, and officials must now prepare a response to all of them. First and foremost, erosion can occur naturally; not all sand is replaced at the equal rate it's removed. But there's that other cause of erosion – rising sea levels – that scientists must now factor into their studies. It's one of the reasons why this study has such dire predictions for the future of Hawaiian beaches.


http://www.weather.com/science/environment/news/hawaii-erosion-new-study


Super Typhoon Maysak Devastates Micronesian Island, Threatens Philippines

Two days after causing widespread destruction in Micronesia, Maysak has intensified into a super typhoon and threatens the Philippines along with other island nations in the Western Pacific. 
Maysak struck Micronesia's Chuuk State on Sunday evening, demolishing up to 95 percent of tin houses on the island, according to Guampdn.com. The unofficial death toll varies, but some say at least five are dead. Communications systems on the island, which has a population around 50,000, were down this weekend, and the full extent of the damage caused by Maysak's battering winds and rain is still unknown. Yap, which is part of the Caroline Islands, and the Philippines are on track to feel Maysak, now the equivalent of a Category 5 hurricane, next. 
Guampdn.com reports that the Ayuda Foundation is already working to provide aid to Chuuk by filling up a 40-foot container with food and building materials for the island's residents. In a radio broadcast, Federated States of Micronesia public information officer Marz Akapito said that boats would arrive on Chuuk with water bottles and medical supplies. After Maysak passes Yap, other boats will conduct more thorough damage assessments. Chuuk locals use mango, banana and cocounut trees, many of which were pulverized by Maysak's winds, as a main source of food. Meanwhile, Yap is preparing for Maysak's impacts as the storm approaches with maximum sustained winds of 160 mph. 

http://www.weather.com/storms/typhoon/news/typhoon-maysak-impacts-chuuk-yap-philippines-guam-pacific

Monday, March 30, 2015

Changin Climate and Mummies

http://www.washingtonpost.com/news/energy-environment/wp/2015/03/09/why-a-changing-climate-could-destroy-some-of-the-worlds-oldest-mummies/


Arica is often referred to as the driest place on Earth — but locals say that’s changing. According to Sepulveda, the city has seen increases in precipitation and humidity of late. “Everybody say[s] that here,” she averred. Indeed, weather historian Christopher Burt wrote about Arica in 2013, noting that despite its famous reputation for dryness, weather records from 1971 to 2000 suggest it has been somewhat wetter than usual of late.
This may not be a change that can be definitively pinned on global climate change caused by humans, cautioned Ralph Mitchell, a Harvard microbiologist who teamed up with the Chilean researchers to figure out what was ailing the mummies. But it’s a change nonetheless. “Our colleagues in northern Chile say it’s terribly obvious that the place is foggy a lot more than it ever was,” Mitchell said.

Arctic Sea Ice Hits New Record

http://www.washingtonpost.com/news/energy-environment/wp/2015/03/19/scientists-say-arctic-sea-ice-just-hit-a-disturbing-new-winter-record/

And now, the Boulder-based National Snow and Ice Data Center (NSIDC), which tracks sea ice, has indeedannounced that the peak winter Arctic sea ice extent “likely” occurred Feb. 25, and that this maximum “not only occurred early; it is also the lowest in the satellite record.” However, the agency does include several caveats. That includes not only the word “likely,” but also the observation that “a late season surge in ice growth is still possible.”
The loss of sea ice around the Arctic has a vast number of consequences. They range from climatic — exposing more dark ocean water, which absorbs more solar radiation than ice does, leading to further warming — to social and cultural: Undermining the subsistence hunting techniques that Alaskan native villages have pursued atop the ice for generations.

Global Warming and Ocean Circulation

http://www.washingtonpost.com/news/energy-environment/wp/2015/03/23/global-warming-is-now-slowing-down-the-circulation-of-the-oceans-with-potentially-dire-consequences/

And now this week brings news of another potential mega-scale perturbation. According to a new study just out in Nature Climate Change by Stefan Rahmstorf of the Potsdam Institute for Climate Impact Research and a group of co-authors, we’re now seeing a slowdown of the great ocean circulation that, among other planetary roles, helps to partly drive the Gulf Stream off the U.S. east coast. The consequences could be dire – including significant extra sea level rise for coastal cities like New York and Boston.
A vast, powerful, and warm current, the Gulf Stream transports more water than “all the world’s rivers combined,” according to the National Oceanic and Atmospheric Administration. But it’s just one part of a larger regional ocean conveyor system – scientists technically call it the “Atlantic meridional overturning circulation” — which, in turn, is just one part of the larger global “thermohaline” circulation (“thermohaline” conjoins terms meaning “temperature” and “salty”).

The Melting of Anartctica

http://www.washingtonpost.com/news/energy-environment/wp/2015/03/16/the-melting-of-antarctica-was-already-really-bad-it-just-got-worse/

A hundred years from now, humans may remember 2014 as the year that we first learned that we may have irreversibly destabilized the great ice sheet of West Antarctica, and thus set in motion more than 10 feet of sea level rise.
Meanwhile, 2015 could be the year of the double whammy — when we learned the same about one gigantic glacier of East Antarctica, which could set in motion roughly the same amount all over again. Northern Hemisphere residents and Americans in particular should take note — when the bottom of the world loses vast amounts of ice, those of us living closer to its top get more sea level rise than the rest of the planet, thanks to the law of gravity.
The findings about East Antarctica emerge from a new paperjust out in Nature Geoscience by an international team of scientists representing the United States, Britain, France and Australia. They flew a number of research flights over the Totten Glacier of East Antarctica — the fastest-thinning sector of the world’s largest ice sheet — and took a variety of measurements to try to figure out the reasons behind its retreat. And the news wasn’t good: It appears that Totten, too, is losing ice because warm ocean water is getting underneath it.

Moore Tornado.


On March 25th a Tornado struck Moore Arkansas, taking someones life.


Following one the quietest starts to severe weather season ever recorded, violent thunderstorms erupted in the central U.S. Wednesday. Multiple damaging tornadoes touched down in Oklahoma, including Moore – which has been ravaged repeatedly by twisters in recent years.
Outside Tulsa, one person was killed and several injured by a twister that sliced through a mobile home park in the suburb of Sand Springs. Many of the homes in the park were destroyed.

March 25 Tornadoes


On March 25th at least 8 tornadoes struck Northwest Arkansas and Northeastern Oklahoma. This post will explain the science behind these disastrous tornadoes. 

sand-springs-tornado

A stalled front over Oklahoma and Arkansas was forecast to move southward as a cold front and provide the focus for thunderstorm formation. Ample instability existed along and south of this front, with values ranging from 2000 to over 3000 J/kg. Deep-layer vertical wind shear – defined as the change in wind speed or direction within the lowest 6 km or 3.5 miles of the atmosphere – was also more than sufficient for storm organization and rotation.
This meant that all of the ingredients for severe weather – instability, vertical wind shear, and a trigger – were in place for severe weather, and the SPC in Norman, OK, issued a moderate risk for severe thunderstorms.

http://www.ustornadoes.com/2015/03/27/the-science-behind-the-oklahoma-and-arkansas-tornadoes-of-march-25-2015/

Sunday, March 29, 2015

Ice planet Hoth.....in Canada

Friday was the first day of spring but Canada's eastern provinces has areas looking like the planet Hoth (starwars).

Surrender snow

http://www.cbc.ca/news/trending/photographic-proof-that-canada-s-east-coast-is-basically-the-ice-planet-hoth-right-now-1.3003008


Increased Rain fall in tropics.

A new study based in part on NASA satellite data has shown that an increase in large, well-organized thunderstorms is behind increased rainfall in the wettest regions of the tropics. Joint research from the Australian Research Council Centre of Excellence for Climate System Science (ARCCSS) and NASA published online in Nature today reveals that rainfall increases seen in places such as the western Pacific in recent decades are actually due to large storms – what the authors call “organized deep convection” – happening more frequently, rather than from individual storms producing more rain.

massive storm cloud rains above the clouds

http://www.nasa.gov/press/2015/goddard/march/increased-rainfall-in-tropics-caused-by-more-frequent-big-storms-0/#.VRXZT_nF_Ws

Record Null coming to an end

Spring has officially started, this is the season for severe weather across the US, however it has been a pretty quiet spring so far. One of the most quietest recorded. The number of tornado warnings have dropped significantly from last year to this year. The number is rather abnormal.

"We are in uncharted territory with respect to lack of severe weather", said Greg Carbin, SPC's warning coordination meteorologist. "This has never happened in the record of SPC watches dating back to 1970."
Since the beginning of 2015, the SPC has issued only four tornado watches and no severe thunderstorm watches, which is less than 10 percent of the typical number of 52 tornado watches issued by mid-March. The approximately 20 tornadoes reported since January 1 is well below the 10-year average of 130 for that time period.
There is no one clear reason to explain the lack of tornadoes, Carbin said. "We're in a persistent pattern that suppresses severe weather, and the right ingredients — moisture, instability, and lift — have not been brought together in any consistent way so far this year." 

Near-Record Lull in Severe Weather Could Come to an End Next Week

http://thevane.gawker.com/near-record-lull-in-severe-weather-could-come-to-an-end-1692859931/+cherylvis

Brush Fires In Australia

Australia is known to have some of the worst Bush Fires / Wild Fires prone country in the world! Due to our extreme weather conditions it is not uncommon for us to have Wild Fires every fire season which are started by a wide variety of causes. They can be attributed to natural causes such as lightning strikes and accidental causes such as sparks from farm machinery, incinerators, power lines, vehicle crashes, escapes from burning off and camp fires. Unfortunately, a large number of bush fires are also deliberately lit.
One useful indicator that can aid forecasters and fire fighter organisations such as the NSW Rural Fire Service determine the potential for bushfires is known as the Haines Index. Simply speaking it combines the dew point depression and atmospheric stability as a means to determine the potential for fire plumes to become organised, entrain dry oxygen rich air into the fire causing explosive plumes to erupt. Also if cumulus clouds known as pyrocumulus develop above the fires, downdrafts from these plumes may create erratic winds as well as another source of oxygen rich air to descend in the vicinity of the fire. The result is the increasing efficiency for fires to spread. What the Haines Index does not take into account are amount of fuel available, wind patterns and topography. All of these factors should be considered by forecasters before determining the potential for bushfire hazards.https://www.blogger.com/blogger.g?blogID=6565483752503740244#editor/target=post;postID=1630036590336812349

Tornado Alley

Tornado Alley Chasing 2007

Although 2007 did not provide the most classic tornadic setups, for those who decided to chase were able to intercept some reasonable storms and tornadoes. In all, Jimmy Deguara intercepted several tornadic supercells with at least 7 confirmed tornadoes (and not including the massive Greensburg tornado and others still to be investigated). The supercells in some cases provided excellent photographic opportunities.
13th April 2007 - although not on the Seymour wedge tornado due to road options, the storm produced a serpentine funnel from the developing tornado. Later on approaching an HP supercell near Fort Worth dangerous giant hailstones prevented an intercept of yet another tornado.
21st April 2007 - intercepted a very large truncated tornado in southeast Colorado SE of Lamar. Extremely rapid storm scale rotation was observed with this storm wrapping rain hiding the tornado from view. Another funnel cloud was observed further north though contact on the ground could not be confirmed.https://www.blogger.com/blogger.g?blogID=6565483752503740244#editor/target=post;postID=5639136141116942788

Extreme Weather events in our future climate

Extreme weather events in our future climate

Temperatures will rise. Everything else gets complicated.

"When an extreme weather event happens, the public wants to know—is this climate change?" That statement by Lawrence Berkeley Lab's Michael Wehner provided a good background for the session on climate change and unusual weather events that happened at the meeting of the American Association for the Advancement of Science. The fact is, scientists aren't well equipped to answer that question—at least not in a way the public's likely to find satisfying.
Instead, Wehner said, science is on solid ground when it examines weather events in terms of probabilities: is the risk of a given event higher? Will the magnitude of a given type of event change?
Wehner went through some historic events and examined how climate change shifted these probabilities. For example, events similar to Europe's 2003 heat wave (which saw 70,000 deaths) are already twice as likely to occur given the amount we've warmed over pre-industrial conditions. If we allow the globe to warm by 2°C over preindustrial levels, that probability goes up to 154 times. "By the end of the century," Wehner said, "when we're likely to see 4°C warming, this event will likely seem cold."
Similar things were possible to say about the 2010 Russian heatwave (2-3 times more likely now, 5-8 times more likely at 2°C of warming) and the 2011 Texas drought (slightly elevated probability now, but up to 10 times more likely at 2°C). None of this is to say that climate change has caused any of these events; they occasionally appear in climate model runs without any added greenhouse gasses. It simply tilts the odds in their favor.https://www.blogger.com/blogger.g?blogID=6565483752503740244#editor/target=post;postID=1316121304915778836

Extreme Events

Extreme Events

Satellite view of hurricane Hugo in 1989
Extreme events such as heat waves, droughts, tornadoes, and hurricanes have affected the United States since the dawn of time. NCDC provides a variety of information detailing these events categorized by type of event.
  • U.S. Records
    This tool lists and maps records tied or broken on a given date for weather stations across the 50 United States. Records are distinguished as daily (largest/smallest for that day on the calendar), monthly (largest/smallest value during that month), or all-time (largest/smallest value ever observed at that station). Summary information for recent periods (year-to-date, month-to-date, last 30 days) is provided in tabular format.
  • Climate Extremes Index
    This index charts the occurrence of specific extreme events over time since 1910. In most cases, extreme events are defined as lying in the outermost (“most unusual”) 10 percent of a place’s history. Analyses are available at the national and regional levels.
  • U.S. Billion-Dollar Weather and Climate Disasters
    The U.S. Billion-Dollar Weather and Climate Disasters report provides readers with an aggregated loss perspective for major U.S. weather and climate events from 1980 to the present. This report provides information on direct economic losses, deaths, and other impacts for numerous weather and climate disasters including tropical cyclones, floods, droughts and heat waves, severe storms (e.g., tornadoes, hail, and straight-line winds), wildfires, crop freeze events, and winter storms. In addition to the report, interactive tools are available to better visualize the data including maps, time series, and statistical tables on the distribution of damage from these extreme events.https://www.blogger.com/blogger.g?blogID=6565483752503740244#editor/target=post;postID=3871077469176546094

Humans Cause Climate Changes

Humans Contribute to Extreme Weather – and Suffer its Consequences

Rigorous analyses have shown that natural variability alone cannot explain the observed long-term trends of changing extremes in temperature and precipitation.12
In contrast, the observed trends fit well with our understanding of how climate change drives changes in weather. Computer models of the climate that include both natural forces as well as human influences are consistent with observed global trends in heat waves, warm days and nights, and frost days over the last four decades.13 Human influence has also been shown to have contributed to the increase of heavy precipitation over the Northern Hemisphere.14
Extreme weather events do not have a single cause but instead have various possible contributing factors – and human-induced climate change is now one of those factors.
Weather variability can be extremely costly. One estimate finds that the total U.S. economic output varies by up to $485 billion/year owing to weather variability.15 From 1980 to 2010 there were 99 weather disasters in the U.S. in which damages exceeded $1 billion. Altogether those disasters cost $725 billion.16 In 2011, the costs of all weather-disaster damages so far has climbed past $35 billion, according to NOAA estimates. As of August 30th, the U.S. has witnessed 10 weather disasters costing over $1 billion each. This breaks the previous record for the number of such U.S. weather disasters in an entire year.17
Changes in extreme weather threaten human health as well as prosperity. Many societies have taken measures to cope with historical weather extremes, but new, more intense extremes have the potential to overwhelm existing human systems and structures.18 More frequent and more severe extreme weather events are more likely to destabilize ecosystems and cripple essential components of human livelihood, such as food production, transportation infrastructure, and water management. Death, disease, displacement, and economic hardship may follow, as we have seen with recent hurricanes, floods, heat waves, and droughts.https://www.blogger.com/blogger.g?blogID=6565483752503740244#editor/target=post;postID=2540031911680861164

Climate Change

A Small Increase in Average Temperature Leads to Big Changes in Extreme Weather

Small changes in the averages of many key climate variables can correspond to large changes in weather.7 Substantial changes in the frequency and intensity of extreme events can result from a relatively small shift in the average of a distribution of temperatures, precipitation, or other climate variables.8

Climate Change Shifts the Odds for Extreme Weather Events


Solomon et al. 2007
Weather variation on our planet can be described with a rough bell-shaped curve. So-called normal weather is very common while extreme weather is rare. While events close to normal occur frequently, in the broad center of the curve, there is a sharp fall-off in the frequency of events further away from normal, in the flatter ends of the curve. For instance, a small increase in temperature shifts the entire curve toward hotter high temperatures. The rarest and most extreme record heat events become even more severe and much more frequent. Precipitation does not follow quite the same pattern, but the same concept applies: fewer light and moderate rains are being replaced by more heavy rain events.https://www.blogger.com/blogger.g?blogID=6565483752503740244#editor/target=post;postID=6138147623617058261

Record Highs Now Outpace Record Lows by 2:1


The ratio of record daily high temperatures to record daily lows observed at about 1,800 weather stations in the 48 contiguous United States from January 1950 through September 2009.
Meehl et al. 2009
Recent weather events such as deadly heat waves and devastating floods have sparked popular interest in understanding the role of global warming in driving extreme weather. These events are part of a new pattern of more extreme weather across the globe, shaped in part by human-induced climate change.
As the climate has warmed, some types of extreme weather have become more frequent and severe in recent decades, with increases in extreme heat, intense precipitation, and drought. Heat waves are longer and hotter. Heavy rains and flooding are more frequent. In a wide swing between extremes, drought, too, is more intense and more widespread.https://www.climatecommunication.org/new/features/extreme-weather/overview/#!prettyPhoto/0/

European Heat wave

European 2003 Summer Temperatures Were Far Outside Normal Range


2003 European Heat Wave: The Hottest Summer in 140 Years (1864-2003). Each vertical line represents the average summer temperature for a single year from the average of four locations in Switzerland over the period 1864 through 2003. This illustrates how far outside the normal range the summer of 2003 was.
Schär et al. 2004
One way in which climate change is connected to individual events such as heat waves and heavy rains is by increasing the odds they will occur. We witness that connection in the form of more frequent extreme events. Analyzing how global warming has changed the odds for a specific event has been done for standout moments such as the European heat wave of 2003 that killed tens of thousands. Based on temperature records from 1864 to 2002, the odds of such a heatwave occurring are about 1 in 10 million.4 An event like the 2003 heatwave becomes much more likely after factoring in the observed warming of 2°F over Europe and increased weather variability.5 In addition, comparing computer models of climate with and without human contribution shows that human influence has roughly quadrupled the odds of a European summer as hot as or hotter than the summer of 2003.6https://www.blogger.com/blogger.g?blogID=6565483752503740244#editor/target=post;postID=1237956798743958554

Friday, March 27, 2015

Do they still call it Antarctica if its warm?

http://mashable.com/2015/03/27/antarctica-all-time-high-temperature-record/
Antarctica, Earth's coldest, most barren continent, may have just set a remarkably unusual weather record. An Argentinian research station on the rapidly warming Antarctic Peninsula recorded a high temperature of 63.5 degrees Fahrenheit (17.5 degrees Celsius) on March 24, according to reports from Weather Underground. 
If this is investigated and verified by the World Meteorological Organization (WMO), it could become the highest temperature on record for the entire continent of Antarctica.
The warmth at the Esperanza research station came one day after a nearly identical high temperature was logged at another Argentinean base, known as Base Marambio, also located along the Antarctic Peninsula. Interestingly, the mild conditions occurred during the Antarctic fall, not the height of summer.
More broadly, the Antarctic ice sheet is proving to be far more dynamic than scientists thought was the case just two decades ago. A study published on Thursday, for example, found that the loss rate of Antarctic ice shelves, which play a crucial roll in buttressing inland glaciers and preventing them from sliding quickly into the sea, has accelerated by 70% in just the past decade. 
This may mean that climate scientists will need to raise their global sea level rise projections. Such projections also take into account ice loss from the Greenland ice sheet, where temperatures are also increasing rapidly.

Southern California Turns White?

Beaches and streets in Southern California suddenly turned white during a hailstorm late Monday morning, stunning residents who quickly ran outside to get a picture or play in the unusual weather.
Enlarge
    The hail was reported in areas like Huntington Beach and Long Beach – areas that have seen little precipitation of any kind in recent months due to a long-term drought that has gripped the West.
    "Upper-level energy associated with Winter Storm Thor has been triggering thunderstorms along the California coast since this past weekend," said weather.com meteorologist Chris Dolce. "These thunderstorms produced small hail that whitened the ground in parts of the Bay Area on Saturday and did the same in Southern California on Monday."
    Winter Storm Thor is expected to move from the West Coast through the Plains and East, affecting parts of 48 states on the way.
    Check out more of the most awesome images from the Southern California hailstorm below.

    Unusual Weather Accelerates Summer Crop Season

    Californian growers are gearing up for another early season of their summer crops following record high temperatures in parts of the state. apricot_69882310 thirdsq
    California Fresh Fruit Association (CFFA) president Barry Bedwell said the industry may be roughly two to three days ahead of last season, which was early in itself.
    The high temperatures began around Friday (March 13) last week, when a high pressure system built up over parts of the state.
    “I think that once again we’re experiencing an early season, and this heat certainly confirms and accelerates that,” he told www.freshfruitportal.com.
    “Having said that, this weather is highly unusual and once again continues to set records. That 91°F (33°C) I think we had in this area [Fresno] on Sunday was an all-time record for the date by four degrees, and one of the hottest temperatures we have seen in the month of March ever.”
    http://www.freshfruitportal.com/2015/03/18/california-highly-unusual-weather-to-accelerate-summer-crop-season/?country=united%20states

    Weather Causes Unusual Amount of Arctic Ice


    http://www.trinitynewsdaily.com/arctic-sea-ice-may-reach-all-time-minimum-low/1158/

    ANCHORAGE – 
    Satellites that take pictures of ice in the Arctic are showing the lowest amount of sea ice ever recorded, according to scientists at the National Snow and Ice Data Center in Colorado.

    “The middle part of the country and the east coast were getting a lot of the cold winter weather, whereas here in Alaska, we were getting more of the warmer weather,” Schreck explained. “There was warm air coming into the state that we don’t usually see.”
    But Schreck said the ice closest to Alaska in the Bering Sea did not look significantly different from last year, with the exception that it may be thinner. She said it’s not unusual for the ice pack to change on an almost daily basis.
    “What happens with the ice — especially during the spring — is so reliant on weather patterns,” Shreck said. “The current weather patterns, not what has happened over the last few months. So it is normal for it to retreat and grow back and retreat and grow back throughout the spring time.”

    Shreck says it’s possible the ice pack in the Bering Sea is still growing, and may not reach it’s maximum extent for another week or so.

    Big storms increase tropical rainfall


    http://www.sciencedaily.com/releases/2015/03/150325151857.htm


    Joint research from the Monash branch of the Australian Research Council Centre of Excellence for Climate System Science (ARCCSS) and NASA published in Nature found even though other types of rainfall has decreased in frequency and the total number of thunderstorms remained the same, the increase in big storms had elevated total rainfall.
    Thunderstorms play an important role in rainfall in the tropics. Despite organised deep convective storms only occurring 5% of the time in the world's equatorial regions, they deliver almost 50% of all its rainfall.
    The research has also contributed to answering the important question whether the increase in rainfall observed in the tropics was simply caused by the fact of a warmer atmosphere or whether the underlying circulation in that region had changed.
    The changes to the deep convection discovered in the study suggested a dynamic change in the climate system was responsible for the change in rainfall.
    The revelation that large thunderstorms appear to be the source of increased precipitation in the tropics explains why climate models may have difficulties in accurately representing the details of tropical rainfall.
    The small-scale processes giving rise to thunderstorms make their direct simulation in climate models impossible given current computing power.
    "This limitation, which is a well-known issue in global climate models, might well be a contributing factor to the precipitation errors and the bias towards light rain," said another author from Monash University, Prof Christian Jakob.
    "Given how important these large storms are to rainfall in the tropics, it is vital that there is a renewed effort to represent convective organisation in global climate models if we are to fully understand precipitation changes in the future."

    Climate Change does not cause extreme weathers


    http://www.sciencedaily.com/releases/2015/03/150327132207.htm


    Repeated cold snaps led to temperatures far below freezing across the eastern United States in the past two winters. Parts of the Niagara Falls froze, and ice floes formed on Lake Michigan. Such low temperatures had become rare in recent years. Pictures of icy, snow-covered cities made their way around the world, raising the question of whether climate change could be responsible for these extreme events.
    It has been argued that the amplified warming of the Arctic relative to lower latitudes in recent decades has weakened the polar jet stream, a strong wind current several kilometres high in the atmosphere driven by temperature differences between the warm tropics and cold polar regions. One hypothesis is that a weaker jet stream may become more wavy, leading to greater fluctuations in temperature in mid-latitudes. Through a wavier jet stream, it has been suggested, amplified Arctic warming may have contributed to the cold snaps that hit the eastern United States.
    Scientists at ETH Zurich and at the California Institute of Technology, led by Tapio Schneider, professor of climate dynamics at ETH Zurich, have come to a different conclusion. They used climate simulations and theoretical arguments to show that in most places, the range of temperature fluctuations will decrease as the climate warms. So not only will cold snaps become rarer simply because the climate is warming. Additionally, their frequency will be reduced because fluctuations about the warming mean temperature also become smaller, the scientists wrote in the latest issue of the Journal of Climate.
    Using a highly simplified climate model, they examined various climate scenarios to verify their theory. It showed that the temperature variability in mid-latitudes indeed decreases as the temperature difference between the poles and the equator diminishes. Climate model simulations by the Intergovernmental Panel on Climate Change (IPCC) showed similar results: as the climate warms, temperature differences in mid-latitudes decrease, and so does temperature variability, especially in winter.
    Temperature extremes will therefore become rarer as this variability is reduced. But this does not mean there will be no temperature extremes in the future. "Despite lower temperature variance, there will be more extreme warm periods in the future because the Earth is warming," says Schneider. The researchers limited their work to temperature trends. Other extreme events, such as storms with heavy rain or snowfall, can still become more common as the climate warms, as other studies have shown.
    Tuesday, March 24, 2015

    California Statewide Snowpack Now Below Record Low Benchmark

    Snowpack in California has reached a new low milestone that has not been seen in more than 30 years. It's just the latest chapter in the dire drought now entering its fourth year.
    According to the California Nevada River Forecast Center, snowpack statewide was just nine percent of average as of March 23. That figure breaks the previous snowpack record for this point in the snow season, set back during the 1976 to 1977 season. 
    "That's not a typo, it's now in single digits," the River Forecast Center said in a Facebook post announcing the new low. 
    Winter storms capable of delivering feet of snow have been scarce so far in 2015. The animation below shows how the snowpack has receded greatly from early January into the middle of March.
    The overall statewide snowpack is calculated based on the combined snow water content of the northern, central and southern Sierra Nevada.
    On March 23,  the central and southern Sierra Nevada were both at 10 percent of average, while the northern Sierra Nevada was at seven percent of average.
    This snow water content is very important for the water supply in California. As the snow melts later in the spring, it helps to replenish reservoirs in the state. As of March 23, all reservoirs near the Sierra Nevada and in northern California were at 60 percent or less capacity, according to the California Department of Water Resources.
    Although northern California reservoirs got a boost from heavy rainfall in February, snow was confined to the highest elevations. This means the moisture-laden storm systems did very little to help the mountain snowpack.