Showing posts with label Kiya Hoyt. Show all posts

Wednesday, April 30, 2014

Torrential Rain Hits Florida Panhandle


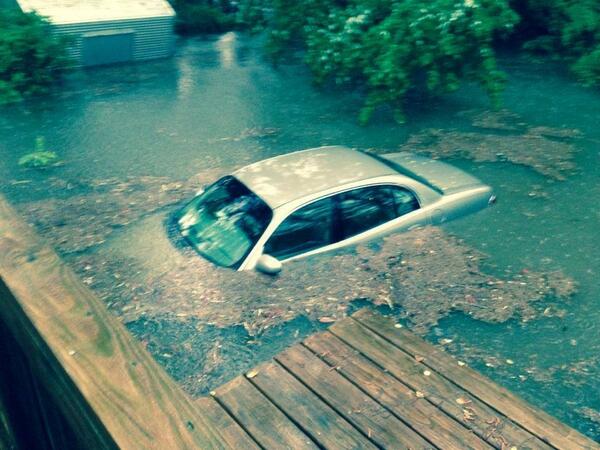
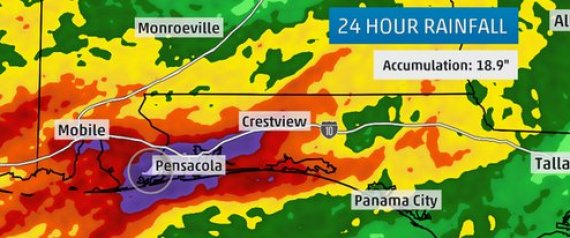
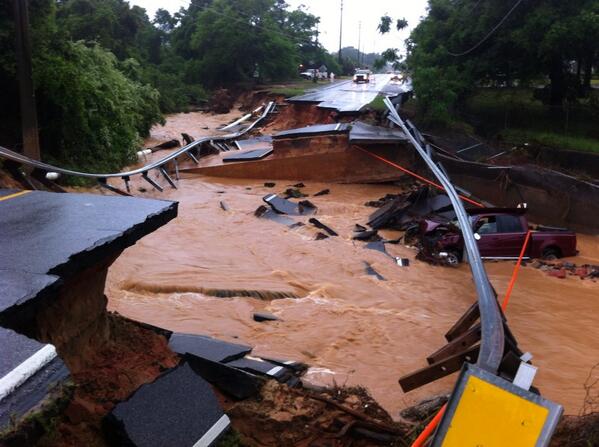
Tuesday night into Wednesday morning, Alabama's Gulf Coast and the Florida pandhandle were hit with torrential rain that caused widespread flooding. As much as 15 to 20 inches of rain fell on the Panhandle over a 24-hour period, and there was plenty of photo documentation. 


Twisters Past and Present: Interactive Tornado Tracker


The heart of the tornado season is upon us, with twisters touching down in parts of the U.S. nearly every week through mid-summer. The 2012 tornado season is already off to a busy start, but fortunately not on the scale of last year’s deadly season.
The 2011 tornado season was the deadliest since modern record keeping began in 1950, as 550 people were killed and about 5,400 injured, many of them during large-scale outbreaks in the Southeastern states. One tornado, an EF-5 monster, became the fourth-deadliest tornado in U.S. history and the most expensive tornado on record when it tore through Joplin, Mo., on May 24.
Now, using Climate Central’s new interactive tornado tracker, you can track tornado reports for this season and investigate reports during past years.
Using the tracker, you can look back at one of the largest tornado outbreaks in U.S. history, which took place last year on April 25-28. Or you can examine one of the big events this season so far, which took place on March 2-3.
The tracker plots tornado reports from NOAA's Storm Prediction Center in Norman, Okla., and is updated multiple times a day to capture breaking events. Keep in mind, though, that this tracker shows reported tornadoes, not confirmed tornadoes. The National Weather Service conducts damage assessment surveys after tornadoes are reported to determine if a tornado actually touched down, and if so, how powerful it was.
The number of tornado reports is typically greater than the number of actual tornadoes, since multiple reports can come in from storm spotters, all reporting the same single tornado at different points along its path.
To access the interactive map and view the entire article, click here:  http://www.climatecentral.org/blogs/twisters-past-and-present-interactive-tornado-tracker

Tornado Technology Innovation Born From 1974 Tragedy


Thursday marked the 40th anniversary of one of the most destructive tornado outbreaks in U.S. history. The event, deemed a Super Outbreak, took place over two days and spawned nearly 150 tornadoes across 13 states and the Canadian province of Ontario. The storm left behind millions of dollars in damage and caused 300 deaths and 6,000 injuries. The only outbreak with more tornadoes occurred in late April 2011.

The map above shows the meticulous detail that went into analyzing the 1974 Super Outbreak by Ted Fujita, who devised the Fujita Scale to quantify the strength of tornadoes. Without computers, Fujita had to hand draw each tornado track and width after doing extensive aerial surveys. The National Weather Service's Wilmington office has a large version well worth looking at if you don't mind the load time.

As shocking as the geographic scope of the outbreak is the number of intense tornadoes it spawned. Of the 148 tornadoes that touched down, 30 were rated F4 or F5, the two most destructive categories. According to U.S. Tornadoes, the U.S. only sees 7 such tornadoes per year, underscoring just how violent the outbreak was.
There was a small silver lining in the aftermath, outlined in a story by the University Corporation for Atmospheric Research’s Bob Henson. During his aerial surveys, Fujita discovered a previously unknown weather phenomenon. Among the wreckage, he noticed not all the damage was consistent with tornado winds, which tend to swirl. Instead, there were areas that were flattened like a rolling pin had gone wild. Further research of this and other similar events found previously unidentified microbursts -- intense downward pulses of air that can disrupt air travel in addition to flattening trees and homes -- as the culprit.
The results have led to aviation safety improvements. “It’s likely that hundreds of deaths have been avoided thanks to Ted Fujita’s uncommon insight, his exhaustive documentation, and the careful field work carried out by NCAR scientists and their collaborators,” Henson wrote.
Tornado prediction has also dramatically improved. To illustrate some of those advancements, the Storm Prediction Center used observations of conditions that preceded the 1974 storm and ran computer models on Wednesday to see how well they could forecast the outbreak if it happened today. It turns out the models were able to identify conditions that were conducive for tornadoes to develop in a number of locations where twisters did touch down in 1974.
That forecast skill come from decades of technological upgrades since the Super Outbreak, including Doppler radar technology and powerful computers  that can crunch exponentially more calculations than their 1974 brethren. And those upgrades are extremely helpful on a day like Thursday when nearly 52 million people are at risk from severe weather according to the National Oceanic and Atmospheric Administration.

Despite Spate of Tornadoes, 2014 on Track for Low Total


Even with the deadly spate of tornadoes spawned this weekend, 2014 is still on pace to see one of the lowest recorded counts for a tornado season, scientists say. That it comes on the heels of one of the busiest seasons on records just a few years earlier is part of a trend in extreme variability that researchers are examining in an effort to determine the cause, including the potential influence of climate change. 

The string of recent tornadoes that stretched from Arkansas to Georgia marked the end to a streak of 159 days without a tornado ranking an EF3 or higher on the Enhanced Fujita scale (which goes from 0 to 5). And after cataloging only 93 tornado reports through April 24, the National Weather Service’s Storm Prediction Center had tallied 87 reports alone on Monday. 

The streak and dearth of tornado reports were indicators of how uneventful the 2014 season has been in its early parts, much like the 2013 season was. The past three seasons have all stood in stark contrast to the 2011 tornado season, which had the second highest tornado count on record.

All of the years since 2011 have actually seen relatively dampened activity in terms of tornado counts, a stark juxtaposition that seems to be following a trend of more extreme changes in tornado activity in recent years, Greg Carbin, the warning coordination meteorologist at the SPC, and his colleague Harold Brooks have found. The pair is looking at whether climate change, among many other factors, could be playing a role in this and other tornado trends. 

For much of the 2014 season, the overriding atmospheric pattern of cooler-than-normal conditions in the eastern U.S. has kept a lid on tornado formation, as the warm, moist air over the Gulf of Mexico was kept at bay. This warm air can flow in over the land surface and make the atmosphere unstable, as it is less dense than cooler air above and so it rises, a necessity to get the thunderstorm activity that produces tornadoes. 

Which Month Is Your State Most Likely To See A Tornado?


The National Atmospheric Administration's National Climatic Data Center compiled this data from 1991 through 2010, revealing the average state-by-state frequency for tornadoes for each month of the year. "There really is no national tornado 'season,'" the agency explains. Rather, tornado potential is greater for different regions at different times of the year. 


Rotating Supercells Resemble a 'Mothership'


They look like an alien invasion, but rotating supercells happen far more often than a visit from E.T.
The photos above are examples of what happens when forces of weather combine to produce an incredibly photogenic sight -- known simply as the "mothership" cloud.
Captured by storm chasers and weather-gawkers, these approaching storms were already ominous. However, with the rise of photo-enhancement apps like Instagram, which allow amateurs to make images appear professionally edited, rotating supercells look more like alien spacecraft than ever.

The Science Behind Supercells

From Nick Wiltgen, weather.com meteorologist in an April 2013 article:
"A supercell thunderstorm is characterized by a sustained and powerful rotating updraft. These storms originate in unstable air accompanied by a particular type of changing wind direction at various altitudes in the atmosphere; a common combination supportive of supercells is a southerly or southeasterly wind near ground level and a southwesterly or westerly wind higher up in the atmosphere.
This combination of changing wind directions creates a horizontal rolling motion in the lower atmosphere. The same rapidly rising air motions that form the thunderstorm turn this horizontal rotation into a vertical rotation, and in the case of this particular storm, this rotation is spectacularly evident in the circular striations, or layers, visible in the cloud structure.
The structure of supercell thunderstorms allows rain and hail to fall well away from the source of the warm, unstable air fueling the storm, so these storms do not choke on their own rain-cooled air. In some cases this allows supercell thunderstorms to stay intact for hours, covering tens or even hundreds of miles. In the process they can produce giant hail, very high winds, and tornadoes."


Tornado Outbreak Kills at Least 37 as Threat Pushes Into Fourth Day


A multi-day severe weather event is expected to continue across parts of the South and mid-Atlantic Wednesday, bringing deadly flooding, damaging winds, hail and tornadoes to the region for a fourth consecutive day.
Flash flooding and at least five tornadoes were reported in eastern North Carolina by Tuesday evening, the Associated Press reported. Meanwhile, areas of the Florida Panhandle were under flash flood warnings Thursday morning as record rainfall left homes, cars and streets under water.
On Monday, dozens of tornadoes flared up across the South inflicting widespread damage across Alabama and Mississippi that contributed to the deaths of more than a dozen individuals. At least 15 people were killed in Mississippi from the wave of tornadoes that scarred the state, nine of which died in Winston County. In Alabama, three people were reported dead, two in the northern part of the state and one in Tuscaloosa. In total, at least 37 people have been killed, and countless more injured, from the severe storms that started in the Midwest Sunday and continue to push into the South into Tuesday.
Arkansas suffered some of the heaviest damage and the largest number of deaths so far from the multi-day severe outbreak, after tornadoes from a long-lived supercell thunderstorm ripped through the center of the state, killing at least 15 people Sunday.

Click here to read the entire article and see the outbreak's impact state by state:  http://www.weather.com/news/tornado-central/severe-weather-tornado-outbreak-late-april-impacts-20140427

Severe Weather Forecast: Threat for Tornadoes, Major Flash Flooding Shifts to the East


  • Severe thunderstorms, with a threat of tornadoes continues Wednesday.

  • Threat of local flash flooding, as well.

A slow-moving, lumbering low pressure system over the central and eastern U.S. will maintain the dual threats of flooding rain and severe thunderstorms through Wednesday night in parts of the East.
The specific forecasts for each day are below. If you are in one of regions affected, be sure you have a plan to get the latest weather information multiple times a day.

    Severe Threat

    • Threat area: Scattered severe thunderstorms from the Mid-Atlantic states to the Southeast coast. 
    • Hazards: Damaging wind gusts, hail and some tornadoes possible.
    • Maximum TOR:CON: 5 in the Carolinas and Virginia
    • Cities: Richmond | Raleigh | Columbia

    Flood Threat

    • Threat area: From parts of Florida to the Mid-Atlantic states, Lower Hudson Valley and parts of southern New England.
    • Timing: Through Thursday morning
    • Rainfall potential: See inset map. Local totals over three inches likely in parts of north Florida and the Mid-Atlantic states.
    • Flood alerts map: Shaded in blue
    • Cities: Norfolk | Washington | NYC

    Saturday, April 26, 2014

    March 2014 Among Hottest on Record


    Last month was the fourth-warmest March since modern historical temperature records began in 1880, according to data provided by NASA's Goddard Institute for Space Studies.
    The global mean temperature for March 2014 was about 0.7°C (about 1.26°F) higher than the 1951-1980 average, placing it fourth in line behind 2002, 2010 and 1990 among the hottest Marches on record.
    Powering last March's near-record global temperatures was a "sea" of extraordinary warmth (shown in the map above, in dark and bright red colors) that stretched across much of Eastern Europe and Russia all the way to the western United States, noted weather.com meteorologist Jon Erdman.
    "March was indeed cold in the eastern United States, much of Canada and parts of southern South America," he said. "However, the broader picture showed a sea of warm anomalies from Europe across Russia to Alaska and the western United States."
    Wildfires burned across a large swath of Siberia in early April, Weather Underground's Christopher Burt pointed out, adding that the southern Siberian city of Chemal soared to a high temperature of 83.7°F on April 2, at least 40 degrees above its average high for the day.

    U.S. Greenhouse Gas Emissions Drop, Halfway To 2020 Goals


    The United States is pumping less heat-trapping greenhouse gases into the atmosphere today than it did a decade ago, the Environmental Protection Agency reported this week, a welcome departure from the trend of rapidly accelerating emissions elsewhere in the world's biggest industrialized countries.
    Emissions of carbon dioxide and other human-produced greenhouse gases – like methane, nitrous oxide, hydrofluorocarbons, perfluorocarbons and others – fell by 3.4 percent between 2011 and 2012, and have dropped by about 10 percent since 2005, the EPA said Tuesday.
    The announcement came in its Inventory of Greenhouse Gas Emissions and Sinks, which the agency submits each year to the Secretariat of the United Nations Framework Convention on Climate Change, the international body charged with assessing the state of the world's climate every few years.
    The drop in emissions was due both to short-term weather factors and longer-term shifts in the U.S. energy mix. "The decline ... was driven mostly by power plant operators switching from coal to natural gas, improvements in fuel efficiency for transportation and a warmer winter that cut demand for heating," the Los Angeles Times reported.
    The 10 percent drop in emissions over the past decade represents progress of just over 50 percent toward the goal of reducing U.S. emissions by 17 percent by 2020, outlined in the Obama administration's climate action plan.

    U.S. Sees Rapid Warming Since First Earth Day


    It’s been 44 years since the first Earth Day was celebrated in 1970, and since that time, average temperatures have been rising across the U.S. This Climate Central interactive graphic shows a state-by-state analysis of those temperature trends.
    Average temperatures across most of the continental U.S. have been rising gradually for more than a century, at a rate of about 0.127°F per decade between 1910-2012. That trend parallels an overall increase in average global temperatures, which is largely the result of human greenhouse gas emissions. While global warming isn’t uniform, and some regions are warming faster than others, since the 1970s, warming across the U.S. has accelerated, previously shown in our report The Heat is On. Since then, every state’s annual average temperature has risen accordingly. On average, temperatures in the contiguous 48 states have been warming at a rate of 0.477°F per decade since 1970.
    Delaware and Wisconsin are tied as the fastest-warming states since 1970, warming at a rate of 0.67°F per decade. Average annual temperatures in the two states are about 3°F warmer than they were 44 years ago. Vermont, New Jersey, and Michigan are warming nearly as fast, and all are warming about twice as fast as the global average. The slowest-warming states are Washington, Georgia, Florida, and Oregon – warming just more than 0.3°F per decade since 1970 — and are on pace with average global temperatures.
    On a regional scale, the fastest-warming areas are the Northeast, Midwest and Southwest, while the Pacific Northwest and Southeast are warming more slowly. Of the lower 48 states, 26 have warmed more than 2°F since 1970, and 16 have warmed more than 2.5°F.

    New York City Could Be Flooded by Storm Surge Every 4 Years


    When a storm, such as Hurricane Sandy, sets waters in New York Harbor rising, those sloshing seas are now 20 times more likely to overtop the Manhattan seawall than 170 years ago, a new study finds.
    The increased risk comes from a combination of sea level rise — which has raised water levels near New York City by nearly 1.5 feet since the mid-1800s — and storm tide, or the amount that local seas rise during a storm. Storm tide is itself a combination of storm surge (the water that a hurricane pushes ahead of it) and the astronomical tide.
    The rise in sea level and storm tide combined puts the odds of storm waters overtopping Manhattan’s defenses at one in every 4 to 5 years, compared to only once in every 100 to 400 years in the 19th century, the study found. (Put another way, the annual chance of a storm overtopping the seawall has gone from about 1 percent to 20 to 25 percent.)
    The storm tide at Battery Park, at the tip of Manhattan, during Hurricane Sandy reached a record 14.06 feet according to the National Hurricane Center’s report on Sandy.
    That high storm tide — more than 4 feet higher than the previous record set in December 1992 and the largest since 1821 — was created by a 9.4-foot storm surge and the evening high tide during a full moon, when tides are higher than normal (though the evening high tide was not as large as the morning one).
    The extreme rise in water level sent the Harbor flooding into the streets of the Financial District and other parts of Manhattan, as well as other city boroughs at depths between 2 to 9 feet above ground level. An estimated 305,000 houses in New York were destroyed, mostly by storm surge, according to the NHC.
    Total damage to the city was estimated at $19 billion, including $5 billion in damage to the city’s subway systems caused by flooding. At least 21 people were killed by the storm surge on Staten Island.


    The World's 18 Most Water-Stressed Rivers


    The Washington, D.C.-based research organization conducted what it calls the Aqueduct project to evaluate, map and score the stresses on water supplies in 180 countries around the world – in both the 100 largest river basins by geographic area, and the 100 river basins with the highest populations.
    The factors it evaluated included: the reliability of each river's renewable water supply, the seasonal variation in its water supply throughout the year, how often floods occur, and how often it experiences drought, as well as how had those droughts can be.
    Eighteen rivers, the group found – from rivers like the Colorado and the Rio Grande in the U.S. to China's Yellow, Liao He and Daliao Rivers – are under what it calls "extremely high" water stress, meaning that more than 80 percent of their water for agricultural, domestic and industrial users is withdrawn each year.
    When droughts occur, they place even more stress on already fragile resources in places like these – countries with a collective $27 trillion in annual economic output, WRI notes – especially when a river basin isn't managed effectively.
    While well-established river management systems, like the decades-old one in place on the Colorado, help ensure "steady, predictable supplies," the report added this caution: "Even the most-established, iron-clad management systems start to crumble under increasing scarcity and stress."

    California Drought: Entire State Now in Drought's Grip


    California's worsening drought reached a new, ominous milestone this week just as the typical dry season begins for much of the state.
    The National Drought Mitigation Center's weekly U.S. Drought Monitor report released Thursday shows the entire state is in some form of drought for the first time since the report began tracking such statistics at the beginning of 2000.
    In a sense, the milestone is symbolic, as the proportion of the state's area in drought surged to 98 percent almost a year ago, on May 7, 2013, and has stayed at or above 94 percent since.
    The Drought Monitor report uses a five-point rating system to designate dry conditions. The lowest level, D0, indicates "abnormally dry" but non-drought conditions. The other four categories, D1 through D4, designate various stages of drought, with D4 labeled "exceptional" – the kind of drought one would expect to occur about 2 percent of the time (e.g., 2 years out of 100) in any given location.
    All categories of drought have expanded to the largest areas yet seen in the 21st century in California. The D4 category expanded into more of the San Francisco Bay Area this week, upping its share of the state's land mass to just under 25 percent, a new high in the Drought Monitor era.

    Droughts to Become More Severe, Frequent Over Nearly a Third of Earth: Study

    The Statue of Liberty, if sea level were to rise 35 meters.

    As much as a third of the planet will likely experience more intense and more frequent droughts by the end of the century if global warming proceeds unchecked, according to a study released last month.
    That's because warming temperatures will mean both less rainfall and less soil moisture for many of the affected areas mentioned in the study, titled "Global Warming and 21st Century Drying" and published in the March issue of the scientific journal Climate Dynamics.
    Even though climate change is forecast to bring more rainfall to certain parts of the world – a phenomenon usually explained as the dry regions of the world will get drier, while the wet will get wetter – the study used the latest climate model simulations to show how higher evaporation rates can lead to droughts even in areas that see an uptick in rainfall.
    The study looked at a pair of drought indices – the Palmer Drought Severity Index, commonly used to measure U.S. droughts, and the Standardized Precipitation Evapotranspiration Index – to estimate warming's impact on both changing rainfall and drying patterns worldwide.
    About 12 percent of the planet will be susceptible to drought by 2100 through changes in precipitation patterns alone, the study found. That number rises to about 30 percent – an area that spans large parts of the western U.S., Europe and China – when evaporation rates are factored in.
    "We know from basic physics that warmer temperatures will help to dry things out," said Benjamin Cook, the study's lead author and a climate scientist at Columbia University and NASA's Goddard Institute for Space Studies, in an interview with The Hindu.
    This not only will mean worse drought for areas already subject to it, the study's authors add, but also in areas that are forecast to become wetter.
    "For agriculture, the moisture balance in the soil is what really matters," said study co-author Jason Smerdon, a climate scientist with Columbia University's Lamont-Doherty Earth Observatory. "If rain increases slightly but temperatures also increase, drought is a potential consequence," he told The Hindu.

    Carbon Dioxide Rises to Highest Levels in 800,000 Years


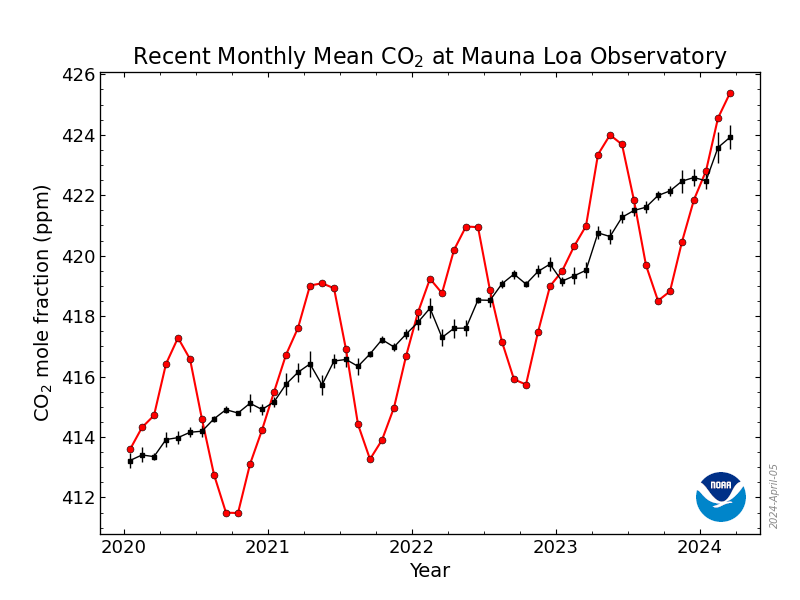
    There's more carbon dioxide in the atmosphere today than at any time in the past 800,000 years – 402 parts per million, in measurements earlier this week – according to a report from the mountaintop observatory in Hawaii that measures concentrations of the greenhouse gas.
    Carbon dioxide (CO2) the most common and most important of the human-produced greenhouse gases, because it is released from so many sources around the world (like factories, cars, airplanes and power plants) and because it can remain in the atmosphere for centuries, adding to global warming for many human lifetimes.
    The CO2 recordings were made at the National Oceanic and Atmospheric Administration's Mauna Loa Observatory, which lies about two miles above sea level near the volcano that shares its name on the island of Hawaii.
    Carbon dioxide levels passed 400 ppm for the first time in recorded history last May and reached that milestone two months earlier this year, on March 16. They rose just above 402 ppm on April 7, and are projected to remain above 400 ppm for the next couple of months, according to Mashable.
    Though the number is largely a symbolic milestone, it's a reminder "that carbon dioxide continues to increase in the atmosphere, and at faster rates virtually every decade," said Dr. James Butler, director of NOAA's Global Monitoring Division. "This is consistent with rising fossil fuel emissions," he added.

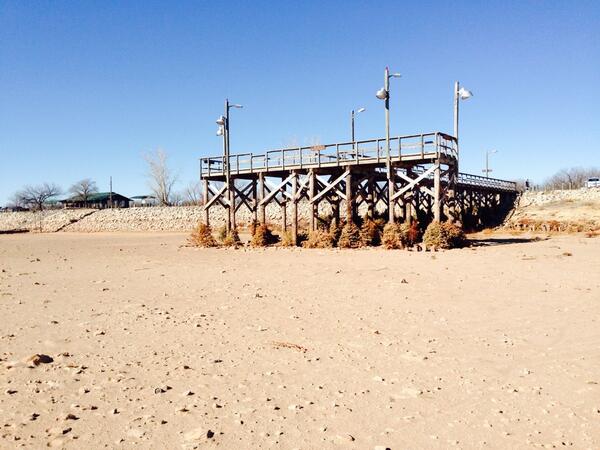
    Dried Up: Lakes, Rivers and Other Bodies of Water Disappearing Fast


    Mankind's insatiable thirst for water resources in recent decades has pushed our most precious natural resource to the brink. Bodies of water, stressed by human consumption, are disappearing quicker than we ever imagined. Many of the world's largest rivers have become victimized by water demand. In fact, as the slideshow above shows, 18 of the world's mightiest rivers are undergoing "extremely high" water stress, meaning more than 80 percent of their flow is withdrawn each year.

    Couple water demand with a grim forecast for more severe droughts due to climate change, and the stress on some bodies of water becomes too much to bear. Ancient shorelines are retreating and leaving behind death and decay in the place of once thriving wetland ecosystems.


    Read the entire article at: http://www.weather.com/news/science/environment/dried-lakes-rivers-and-other-bodies-water-disappearing-fast-20140425?pageno=1

    Texas Drought Forces Wichita Falls Residents to Take Desperate Measures to Keep Water Flowing


    It's hard to image a city of 105,000 running out of water, but that's the reality in Wichita Falls, Texas. A crippling four-year drought has taken this community to a place they've never been before.

    "It's been awful here. We're entering our worst drought on record," said Russell Schreiber, the city's public works director, and the force behind one of the most controversial plans in Texas: The use of treated wastewater for public consumption. It's a bold move — and a tough sell.

    Tim McMillin, a radio host and father in Wichita Falls, is one of the many residents who doesn't like the idea of drinking treated wastewater.

    "Just the concept of drinking the water that yesterday you sent along its merry way ... I don't think anybody wants that."

    McMillin worries about his kids' safety when this new plan is instituted. "I have no way to test it myself," he said.

    He won't have to just yet. The Texas Water Commission is reviewing more than 8,000 pages of data to ensure Wichita Falls' new state-of-the-art treatment facility is working.

    It's capable of treating 5 million gallons of water a day, and has the full support of Mayor Glenn Barham.

    "That water will be safe," Barham said. "I'll be the first to take a drink when they turn it on."

    Here's how it works. Four stages of high-tech filters remove all solid material from the water. The final stage is a process called reverse osmosis, which strips nearly everything out of the water but the basic hydrogen and oxygen molecules.

    Treated water alone can't save this community. This is the driest three-year period in recorded history. It started with a brutal summer heat wave in 2011, when Wichita Falls endured more than 100 days of temperatures above 100 degrees and saw a mere 13 inches of rain. 

    Drought restrictions are in place, prohibiting all outdoor water usage. City officials will begin issuing fines up to $2,000 for people who turn on the hose, wash their cars or fill their pools.


    Read entire article at: http://www.weather.com/news/science/environment/wichita-falls-texas-cracked-20140423

    No Tornado Deaths: 2014 Has Longest Fatality-Free Start in 99 Years


    Even as we push deeper into the heart of spring tornado season, 2014 has so far completely spared Americans the agony and grief of tornado-related deaths. The year's long early safe streak has put 2014 in rare territory, historically.
    The modern era of tornado records began in 1950 with the advent of the storm database maintained by NOAA's Storm Prediction Center. This year has now gone on longer than any other calendar year in that era without a tornado fatality.
    The previous record belonged to 2002, when the year's first killer tornado struck April 21 -- an F3 that killed a man in a mobile home in a rural area of Wayne County, Illinois.
    Another recent year's long quiet streak ended rather violently. This past Sunday marked the 10th anniversary of 2004's first killer tornado, also an F3 in Illinois. Eight people died on April 20, 2004 when a twister smashed into Utica, Ill., causing a tavern to collapse. The twister was part of an outbreak of 30 tornadoes notable because human and computer forecasts made only hours earlier indicated the atmosphere would not be unstable enough for tornadic activity.

    Severe Weather Forecast: Outbreak of Severe Storms and Tornadoes Possible Through Early Next Week


    An outbreak of severe thunderstorms and tornadoes could occur from this weekend through early next week as a potent storm system slowly pushes east across the nation. Locations from the Plains into the Mississippi Valley, Ohio Valley and parts of the South could see severe weather on one or multiple days. 
    This widespread threat of severe weather begins Saturday in the Plains. If you are in one of regions affected, be sure you have a plan to get the latest weather information multiple times a day. The specific forecasts for each day are below.

    Saturday

    • Threat area: Severe thunderstorms are expected to develop along the dryline late in the day (a kind of front that differentiates between moist air to the east and dry air to the west) from western Texas northward into Oklahoma, Kansas eastern Nebraska and southeast South Dakota. 
    • Hazards: Regions illustrated in red within the inset map (right) should prepare for large hail, damaging winds and isolated tornadoes.
    • Cities: Abilene, Texas | Oklahoma City | Wichita, Kan.

    Sunday

    • Threat area: Severe thunderstorm and tornado outbreak possible in the regions illustrated in red within the inset map (right). This includes locations from eastern portions of Texas, Oklahoma, Kansas and Nebraska eastward through Arkansas, Missouri and northern Louisiana to just east of the Mississippi River. 
    • Hazards: Damaging winds, large hail and multiple tornadoes possible. Some tornadoes could be strong (EF2 or higher rating). Excessive rainfall could trigger flash flooding.
    • Maximum TOR:CON: 6 to 7 in parts of Arkansas, northern Louisiana, western Missouri and northwest Mississippi.
    • Cities: Tulsa, Okla. | Kansas City, Mo. | Fort Smith, Ark. | Little Rock, Ark. | Shreveport, La.

    Monday

    • Threat area: Severe thunderstorm and tornado outbreak possible in the regions illustrated in red within the inset map (right). This includes parts of the Mississippi Valley, Ohio Valley and the South.
    • Hazards: Damaging winds, large hail and multiple tornadoes possible. Some tornadoes could be strong (EF2 or higher rating). Excessive rainfall could trigger flash flooding.
    • Maximum TOR:CON: 6 in Louisiana and Mississippi.
    • Cities: Memphis, Tenn. | St. Louis | Jackson, Miss. | Birmingham, Ala.

    Tuesday

    • Threat area: Severe thunderstorm and tornado outbreak possible in the regions illustrated in red within the inset map (right). This includes locations from the South to the Ohio Valley and southern Great Lakes.
    • Hazards:  Damaging wind gusts, large hail and tornadoes possible. In addition, heavy rainfall could trigger flash flooding.
    • Maximum TOR:CON:  5 in southern Mississippi and central/southern Alabama.
    • Cities: Atlanta | Nashville | Birmingham, Ala. | Louisville, Ky. 
    The threat of severe weather may continue in parts of the Mid-Atlantic and Southeast on Wednesday.