An article from the New York Times details the findings from a collection of scientists on the impact that climate change has had on the likelihood of Torrential downpours within the Gulf Coast. The article explains the process they underwent as having involved previous recordings of rainfall, and computer models that were used to create a model of the current climate. The researchers involved found that climate change has increased the likelihood severe rainfall in this region by at least 40%; although Heidi Cullen, the chief scientist for Climate Central, claims that it is much more likely that the initial probability has actually doubled due to climate change. The one thing that the researchers all agreed upon, however, is that Climate change has had a very real impact on the rainfall.
The increase in deluges has caused devastation along the Gulf Coast, especially in Louisiana. The article sites an instance in which a large storm stalled over the southern portion of Louisiana, dropping two feet of rain within 48 hours causing massive losses to homes and businesses, but also killing 13 people, leading people to site the event as the nation's worst natural disaster since Hurricane Sandy in 2012. The Governor of Louisiana, John Bel Edwards, anticipated the damage to cost around 9 billion dollars.
The new process of using these advanced models to compare rainfall from prior years has allowed climatologists to better link specific storms to climate change, and is being referred to as attribution studies. It allows the scientists to compare the likelihood of cataclysmic events before the massive output of carbon dioxide had afflicted our atmosphere, and now, after all that.
The scientists are also seeking to speed up the process of doing these studies, as it typically takes months to complete. The study of the storm in Louisiana, for instance, was intended to detail the effects of climate change as soon as possible. World Weather Attribution, the research team which conducted this study, has started using previously run models in their own.
http://www.nytimes.com/2016/09/08/science/global-warming-louisiana-flooding.html?rref=collection%2Ftimestopic%2FWeather&action=click&contentCollection=timestopics®ion=stream&module=stream_unit&version=latest&contentPlacement=1&pgtype=collection&_r=0
Thursday, September 29, 2016
South Australia Falling Victim To Storms
Southern Australia is becoming beckoned with water. The city of Port Pirie has been flooded. The town of Sevenhill has been warned of their dam weakening. Victoria, New South Wales, the ACT, Tasmania, and South Australia have all received severe weather warnings. The storm is reported to be one of the worst in 50 years. 80,000 lightning strikes have been reported with 22 transmission towers flying from the ground. 30,000 residents are without power, with the threat continuing in South Australia. Winds ranging from 50 to 140 km/hr have been reported. Sea levels have been reported to be slightly rising. Combining with the wind conditions shall result in coastal erosion and damage.


http://www.news.com.au/technology/environment/almost-the-entire-south-east-corner-of-australia-under-severe-weather-warnings/news-story/093893a832c03638faa73981bc7c27e0
Paraguay Under Water
Paraguay is in a State of Emergency after flooding has forced around 100,000 people to evacuate. It is the worst flooding in decades for the area. In the capital, Asuncion, the water level has reached 26 feet, the record level since 1992. It is due to rain and swelling rivers. The government aid has not been reaching people in time, and people have had to dip into their savings, if they have any.


There was no official death report, however, the locals have stated that people have been electrocuted and several were killed by falling tress.
Nutrient Pollution From Cities Negatively Affecting Sounds From Marine Life.
According to an article in the online journal Landscape Ecology a process known as eutrophication, a water based ecosystem's response to an increase of nutrients, primarily phosphates, has caused certain ecosystems to become more silent when compared to ecosystems not affected by eutrophication. The article claims that a majority of the sounds that have gone missing primarily belonged to shrimp and sea urchins, but also came from fish. The primary reason that this is an issue is because many marine animals use sound to locate shelter, meaning that without the ability to find shelter their populations are likely to be at risk.

The writers of the article also found that the audio recordings in ecosystems near under-water volcanic vents, which act as accurate predictors of how future marine ecosystems will behave if climate change continues to be poorly managed, matched the audio recordings of systems which had been afflicted by eutrophication. The article concludes by suggesting that reducing the amount of nutrient pollution in areas near bodies of water would help to strengthen those ecosystems.
https://www.sciencedaily.com/releases/2016/09/160906103149.html
Wednesday, September 28, 2016
Heatwaves in the Ocean: A Risk to Ecosystems?
An unusually long-lasting warm water bubble -- nicknamed 'The Blob' -- spread across the surface of the Northeast Pacific from winter 2013/2014 to the end of 2015. The warm water bubble at times measured up to 1,600 kilometres in diameter and had water temperatures of more than 3 degrees Celsius above the long-term average. Because warm surface water has a lower density than the cold deep water, the exchange of nutrient-rich deep water with warm surface water was reduced, especially along the west coast of North America. This had far-reaching consequences for marine organisms and ecosystems: the growth of phytoplankton decreased due to the reduced supply of nutrients, and some zooplankton and fish species migrated from the warm and nutrient-poor water to cooler regions. By contrast, researchers found pygmy killer whales in the North Pacific for much longer than usual: this tropical whale species is usually observed 2,500 kilometres further south.
A stronger but shorter heatwave hit Australia's west coast at the turn of the year 2010/2011, with sea temperatures of up to 6 degrees Celsius above normal levels for that time of year. The seabed along the coast of Western Australia is known for its high concentration of brown algae. These marine 'kelp forests' have similar functions as terrestrial forests: they provide habitat and food resource to numerous species; in particular a large number of fish. Australian researchers demonstrated that most of the kelp forest stocks rapidly disappeared during this heatwave. In total, an area of 1,000 square kilometres of kelp forest was lost -- this corresponds to twice the size of Lake Constance. Today, algae stocks haven't recovered yet. Instead, a new ecosystem with tropical fish and seaweeds has developed.
As the world's oceans continue to warm, marine heatwaves are likely to become more frequent and intense. Observations and model simulations also demonstrate that other factors such as ocean acidification and deoxygenation are putting additional stress on marine organisms and ecosystems.
Until recently, climate models were unable to accurately represent the relevant physical and biogeochemical processes to simulate extreme events in the ocean and predict future changes. The uncertainties in future projections, particularly at the regional scale, were simply too large. New model simulations linking the global carbon and oxygen cycle with high-resolution physical processes now enable us to make quantitative predictions about the frequency, strength and spatial distribution of future extreme events in the ocean for the first time. And this is precisely what my scientific research focuses on. But in order to better understand the impact of these extreme events on individual organisms or entire ecosystems and their socioeconomic services, interdisciplinary collaborations are urgently needed. Research on understanding such events is only just beginning.
https://www.sciencedaily.com/releases/2016/09/160919131958.htm

Tuesday, September 27, 2016
Growth of the 2015-16 El Niño followed by the Incredible Shrinking La Niña forecast
I’m back with yet another GIF animation because I think I’ve developed a mild addiction to them[Editor’s note: that’s a classic denial by a serious addict]. Words mean one thing, but movies, well, they can reveal a lot. In this case, we wanted to show you every single North American multi-model ensemble forecast for ENSO over the past year and a half. This does not include every model that forecasters consider when developing their consensus outlook, but it includes a lot of them.
This particular animation displays once-a-month data of sea surface temperature departures averaged in the Niño-3.4 region in the equatorial Pacific Ocean, which is one key location to monitor ENSO variations. Persistent positive numbers in excess of +0.5°C indicate El Niño, and persistent negative numbers less than -0.5°C indicate La Niña.
Black line: these are the Niño-3.4 (ENSO) observations for each month starting in January 2015 and ending in August 2016
Purple lines: each line represents a forecast from a different model (1). There are 9 models shown in this animation, which are run at the beginning of each month (by the 6th-8th of each month) by various researchers and agencies across North America. The year and month in the upper right corner tells you when the model prediction was made. We like to examine different models because it is the forecasting equivalent of crowd sourcing. In climate prediction, no one model is clearly better than the rest, so this allows us to see the potential range of outcomes.
Grey lines: Showing the past model forecasts dating back to January 2015 (2).
Okay, now watch it until the room spins—I mean just a few times—and I’ll point out some of the more interesting features below:
Flooding in Chile’s Atacama Desert
Between March 24-26, a low-pressure system meandered to northern/central Chile from the southwest resulting in one to two inches of rainfall in 24 hours on March 25. A station south of the desert recorded more than 2 inches. An inch of rain represents multiple years worth of rain for the Atacama Desert. Areas this dry simply cannot handle a large amount of rain in a short period of time. The rock hard ground does not absorb the water. The lack of vegetation leads to rapid erosion and a massive generation of mud. Dry river beds become rushing torrents of water capable of destroying anything in their path.
In this case, the Copiapó River, which government officials in Chile said had been virtually dry for 17 years (!) rapidly filled with rainwater and overflowed its banks. The cities of Copiapó and Antofagasta in the Atacama and Antofagasta regions of northern Chile saw flash floods rush through their downtowns. According to Reuters, Chilean president Michelle Bachelet has claimed it will cost $1.5 billion to repair all of the damages. The floods have claimed the lives of at least 24 people and displaced thousands.

What's Causing Louisiana's Historic Flooding?
An "inland sheared tropical depression" is how the National Oceanic and Atmospheric Administration's National Weather Service (NWS) described the heavy rain event on Friday morning (Aug. 12). The NWS also noted that the moisture content in the atmosphere was close to an all-time record for the area, even higher than observations during some tropical cyclones.
"Like a tropical depression, the low had a warm core, and the counterclockwise flow of air around the storm brought huge amounts of tropical moisture from the near-record-warm waters of the Gulf of Mexico and northwest Atlantic northwards over land," meteorologists Jeff Masters and Bob Henson wrote on their blog, Weather Underground. "The amount of moisture in the atmosphere over the Gulf Coast region over the past week has been nothing short of phenomenal," they wrote.
A combination of tropical moisture and low pressure fueled the immense rainfall in Louisiana and southwest Mississippi, the meteorologists said. When so much moisture is in the atmosphere, storms can produce rainfall of several inches in a single hour, resulting in astronomical totals over time, the meteorologists said.

El Niño, global warming combine to cause extreme drought in Amazon rainforest
The El Niño effect is part of a cycle of global heating and cooling associated with the changing temperatures of a band of ocean water in the central and east-central equatorial Pacific ocean. Repeating every three to five years, it is one of the main drivers of climate variability. Although its consequences are felt at the global level, its impact on tropical forests -- particularly the Amazon rainforests -- are considered particularly significant, since this ecosystem is considered one of the planet's main carbon sinks.
Some El Niño events, like those of 1982/1983 and, especially, 1997/1998, are stronger than average. In 2014 alarm bells started ringing at the possibility of another such 'Mega Niño', as they are known, though ultimately not all of the necessary conditions converged. However, in 2015 they all fell into place, leading to the current 2015/2016 event, which, coupled with the trend of global warming, is proving more extreme than any on record.
The study, by researchers at the Universitat de València and published in Scientific Reports, shows how the current El Niño event is associated with an unprecedented heating of Amazonia, reaching the highest temperature in the last forty years and, probably, the last century. Additionally, extreme drought has hit a much larger area of this region than usual and is distributed atypically, with extremely dry conditions in the northeast and unusual wetting in the southeast (something which occurred in 2009/2010, though to a lesser extent).
According to the UV scientists, this fact, not observed in the 1982/1983 and 1997/1998 events, implies that, the more the central equatorial Pacific is heated, the more marked the difference between and distribution of the wet zones and areas of extreme drought in the Amazon rainforest.
Some studies associate the current context of global warming to a greater frequency of these stronger El Niño event, although no clear consensus exists among scientists. The severity of the impact of these extreme drought events on tropical forests has to do with the lower absorption rate of atmospheric CO2, as well as an increased risk of fires and the consequent loss of biomass.
Currently the temperature of the Pacific ocean is neutral, with odds at slightly over 50% of entering La Niña, the cold phase of this natural global climate cycle. However, the drought is expected to continue over the coming months.
The research behind this study was carried out using climate data and temperature and rainfall records generated by the European Centre of Medium Range Weather Forecasts, the Met Office Hadley Centre and the University of East Anglia's Climate Research Unit, as well as satellite imagery. Some of these data are available on the Termal Amazoni@, developed by the UV's Global Change Unit.
Taking part in this research were: Juan Carlos Jiménez Muñoz and José Antonio Sobrino, from the Global Change Unit, based at the Image Processing Lab at the University's Science Park. They were joined by scientists from the University of Chile, University of Leeds, University of Maryland, Geophysical Institute of Peru, University of Oxford and Royal Netherlands Meteorological Institute (KNMI).
WMO rules on longest distance and longest duration lightning flashes
he lightning flash over Oklahoma in 2007 covered a horizontal distance of 321 kilometers (199.5 miles). The lightning event over southern France in 2012 lasted continuously for 7.74 seconds, the WMO evaluation committee found.
"Lightning is a major weather hazard that claims many lives each year," said WMO Secretary-General Petteri Taalas. "Improvements in detecting and monitoring these extreme events will help us improve public safety."
It is the first time that lightning has been included in the official WMO Archive of Weather and Climate Extremes, which is maintained by the WMO Commission for Climatology and documents details of records for heat, cold, wind speed, rainfall and other events.
Full details of the assessment are given in an Early Online Release posting of the article published on 15 September. The article will be formally published in an upcoming issue of the Bulletin of the American Meteorological Society.
Dramatic improvements in lightning remote sensing techniques have allowed the detection of previous unobserved extremes in lightning occurrence and so enabled the WMO committee to conduct a critical evaluation.
The WMO evaluation committee judged that the world's longest detected distance for a single lightning flash occurred over a horizontal distance of 321 km (199.5 miles) using a maximum great circle distance between individual detected VHF lightning sources. The event occurred on 20 June 2007 across the state of Oklahoma.
Accidental Icy Imprints

This icy imprint was left standing even after a Jeep pulled away from this parking lot in Greenville, North Carolina on
February 17, 2015
February was brutally cold in most of the East. Other than New England's giant snow piles, an icy photo from North Carolina may have been most emblematic of that month's misery.
Following a period of sleet and freezing rain, a Jeep didn't take its ice accumulation with it when pulling out of a Greenville, North Carolina, parking lot. It left it there.
Another amazing ice imprint came during Winter Storm Cara in Oklahoma. After accumulating into a sheet of ice on a speed limit sign, it appears some melting allowed the sheet to inch down the sign in Mustang, Oklahoma.
High Plains EF3 Tornadoes in November!

A tornado spins in the Texas panhandle between the towns of Groom, Pampa, and Codman on November 16, 2015.
Strong tornadoes are a common sight in the southern and central High Plains. But not in November.
On November 16, a trio of EF3 tornadoes tore through parts of the Texas panhandle and far southwest Kansas, part of a multi-day outbreak of an estimated 53 tornadoes from the Plains to the Southeast through November 18, according to severe weather expert, Dr. Greg Forbes.
These were the farthest west F/EF3 November tornadoes on record in the U.S., dating to 1950, according to NOAA's Storm Prediction Center (SPC) database, as plotted by the Tornado History Project.
The Texas panhandle EF3 tornadoes missed the town of Pampa, Texas, but levelled a Halliburton plant outside of town. The third EF3 struck a farm house west of Kismet, Kansas.
May and June are typically the most active months for tornadoes in the High Plains from southwest Kansas to the Texas panhandle, according to SPC climatology.
If that wasn't enough, the Kismet, Kansas, EF3 tornado was also believed to be the widest documented November tornado of record, estimated at 1.136 miles wide, according to the Dodge City, Kansas, National Weather Service storm survey.
More wet weather for Waikato
Damp days in the Waikato aren't going to change anytime soon.
MetService meteorologist Lisa Murray said the region has had wet weather of late and it will continue well into next month, including this weekend.
A series of lows and troughs moving over the North Island are bringing some stormy weather and it's a bit odd for this time of year.
Murray said this is not to say the Waikato won't get better weather in between, but cloud and rain will dominate over the next few weeks.
"The unusual thing is we are right in the height of spring."
Murray said spring conditions generally bring strong westerlies, but the weather seems to be in reverse.
She said one good thing is farmers who are starting to think about planting summer crops will be happy to get a bit of rain to keep their soil soft, as long as it is accompanied by a bit of sunshine.
"The warm, humid temperatures we're getting are good for germination

http://www.stuff.co.nz/waikato-times/news/84581097/more-wet-weather-for-waikato
Fourth Typhoon set to impact Taiwan
Citizens of Taiwan have been having a very hard time coping with the numerous devastating typhoons. Nepartak, being the first, occurring back in July crashed into the city of Taiwans southeast coast. Earlier this month, Meranti, classified as a category 4, occurred a bit south Taiwan, and Malakas slammed into the capital Taipei as a category 4 also just a bit over a week ago. These hurricanes collectively have caused tremendous damage and has dumped a lot of rain throughout the island, causing many to evacuate their homes.
However it seems as if the citizens of Taiwan troubles aren't just over yet as a fourth typhoon, Megi, is predicted to hit the island by Thursday. Specialist believe it may shift from a category 2 into a category 3 which would be devastating for those in Taiwan.


Monday, September 26, 2016
Earth's Atmosphere Is Losing Oxygen at an Accelerated Rate, Study Says
Oxygen levels in the Earth's atmosphere are on a downward spiral, but it's nothing to panic over just yet, researchers say.

In a study published in the journal Science, a team of scientists, led by researchers from Princeton University in New Jersey, tested the concentration of oxygen in the atmosphere and found that levels have dropped by almost 0.7 percent over the past 800,000 years, compared to modern levels.
More disturbing, the rate seems to have sped up over the past century, dropping by a further 0.1 percent.
Although oxygen levels do seem to be decreasing faster, the decrease is nothing to panic over, the researchers say.
Oxygen levels fluctuate from time to time but are currently registering at around 21 percent. In the course of the 4.3 billion-year history of Earth, there have been two major spikes in oxygen levels linked to explosions of life.
Methodology
https://weather.com/science/nature/news/earth-atmosphere-losing-oxygen
After Days of Preparation, Cedar Rapids Waits For Floodwaters to Arrive
Residents in Iowa's second-biggest city scrambled to complete preparations as the rising Cedar River neared its crest following a week of flooding in the Midwest.
Authorities urged thousands to leave their homes and businesses in Cedar Rapids, Iowa, Sunday as floodwaters began to crest along the Cedar River. Volunteers filled some 250,000 sandbags to fortify homes. A 9.8-mile sand-filled and earthen barrier was erected since last week to hold back floodwaters, according to The Des Moines Register.
“It’s crunch time in Cedar Rapids,” said Mayor Ron Corbett during Monday’s flood briefing. “The next 48 hours are the most critical. The next 48 hours are the most dangerous. And the next 48 hours we need 100-percent cooperation from the citizens in both the evacuation area and outside the evacuation area.”
The recommended evacuation was not mandatory, but fire officials requested names of the next of kin from those who didn't leave their homes, according to USA Today.
https://weather.com/news/news/midwest-flooding-storms-emergency-impacts

Iowa City is getting ready for Flooding
Flood waters are expected to reach 23 feet Tuesday, which is the second highest recorded flood waters in city history. Miles of levees have been constructed and thousands of sandbags have been laid in preparation. Only about half of the residents in flood zones have been evacuated. Flooding has already started rising up to roads and around the outskirts.
"Yes, city officials said at a Monday news conference. Mayor Ron Corbett said nearly 10 miles of temporary levees have been constructed in just days, and 250,000 sandbags have been filled and placed to protect homes and businesses. More sandbags were being filled Monday to beef up barriers around critical city infrastructure. The Fire Department has staged boats for water rescues on both sides of the river. The American Red Cross has opened two shelters, and a local official said more emergency workers are flying in to help."
"The river crested Saturday night in Waterloo and Cedar Falls, which are about 55 miles upstream from Cedar Rapids. The water levels in Cedar Falls and Waterloo were slightly lower than had been expected, but they still reached levels that were second only to those in 2008."
http://www.foxnews.com/us/2016/09/26/iowa-city-prepares-for-highest-floodwaters-since-2008-record.html
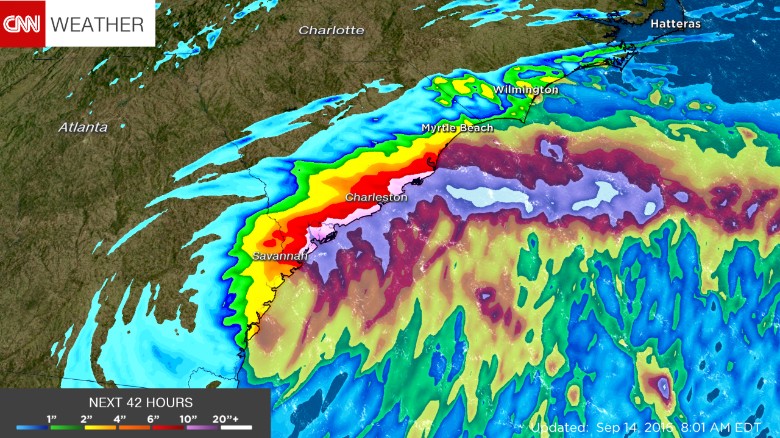
Tropical Storm Developes Over Land
Tropical Storm Julia formed over the state of Florida September 13th. It is extremely rare for a storm to earn the rank of tropical storm while inland, but this storm has done it due to the saturation in the soil. It gained tropical storm force winds for 12 hours which qualified it for official status. It weakened further inland and became a low-pressure system.
"Another interesting phenomenon could also be at play: the "brown ocean" effect, in which a tropical cyclone gains enough energy from a saturated Earth to keep a warm core. It's too early for scientists to know for sure what caused Julia to form over land, but these theories will certainly be researched as a result of this rare formation."
http://www.cnn.com/2016/09/14/us/tropical-storm-julia-weather/index.html
Typhoon Megi Closing in on Taiwan; Typhoon Warnings Issued
Typhoon Megi, a Category 2 equivalent typhoon in the western Pacific Ocean, is closing in on Taiwan, the fourth typhoon to landfall or brush Taiwan this season. Megi
is currently located just over 300 miles southeast of Taipei, Taiwan.
Megi rapidly intensified with wind speeds increasing from a 50 mph
tropical storm to a 105 mph typhoon in just 24 hours this weekend. Monday, it appeared Megi was replacing its eyewall, something common in stronger tropical cyclones.
 |
| Current Storm Status Taiwan's Central Weather Bureau has issued typhoon warnings and a number of "extremely heavy rain advisories" ahead of Megi. Radar from Taiwan's Central Weather Bureau (CWB) shows Megi's broad shield of rain pushing toward Taiwan now. Megi will make landfall in Taiwan Tuesday afternoon, local time. Taiwan is 12 hours ahead of U.S. Eastern daylight time. There is still some chance Megi gains some intensity coming off the eyewall replacement cycle, but it is running out of time before landfall. Full Article Here |
Tropical Depression Nineteen-E Expected to Become Seymour in the Eastern Pacific
Tropical Depression Nineteen-E became the latest tropical cyclone of a busy 2016 eastern Pacific hurricane season Monday morning. This system was located over 1,100 miles east-southeast of Hilo, Hawaii, as of Monday afternoon. Strengthening is expected, and this system will likely become Tropical Storm Seymour soon. However, the "future Seymour's" lifespan will be short. Strong wind shear will eventually rip apart this system by late in the week well east of the Big Island of Hawaii.Thus, it is no threat to the Hawaiian Islands.
 |
| Current Storm Information, Infrared Satellite Image Full Article Here |
Bay Area Heat Wave
A second consecutive day of scorching heat was on tap Monday around the Bay Area with record-breaking temperatures and unhealthy air expected all day. Repeating Sunday’s alert, the National Weather Service issued a heat advisory for the entire region as temperatures turn from uncomfortable to unhealthy.
“It’s going to be warmer today than it was yesterday,” said Anna Schneider, a meteorologist with the weather service. And on Sunday people were even sweating in the shade. Temperatures around the region broke records including at San Francisco International Airport where it hit 94 degrees, breaking the 1978 record of 91 degrees for the date.
But Monday’s heat was set to push into the 90s, threatening to fuel the fire’s activity. Unlike Sunday when the flames really took off, winds on Monday were expected to be mellower, forecasters said. Out on the coast where there’s usually some refuge during these sweltering days, temperatures will be in the 80s. From there, things only get hotter.
Temperatures in the inland East Bay will near or pass the century mark, Schneider said. And for the second day in a row, the Bay Area Air Quality Management District issued a Spare the Air Alert. Residents were asked to avoid driving due to unhealthy, stagnant air around the region. An intense system of high pressure that’s causing Monday’s hot spell was expected to weaken on Tuesday as temperatures begin to drop through the week, forecasters said.

http://www.sfgate.com/news/article/Day-2-of-Bay-Area-heat-wave-could-topple-more-9284754.php#photo-11034202
California Drought
California has experienced droughts that lasted longer than most human civilizations do, and the next drought could well last longer than any of us are going to be around for. That’s because, according to new research from climate scientists at UCLA, America’s most populous state has long been susceptible to long-term drought conditions, and the advent of global warming and the increase in greenhouse gases make it all the more likely that the next drought could effectively be permanent
There are a whole bunch of factors that can reshape a region’s climate, from a shift in solar activity to a dip in volcanic eruptions. The general name for these phenomena is radiative forcing, which in the past has been responsible for droughts in California that lasted anywhere from 60 to 5,000 years. As lead researcher Glen MacDonald points out, a drought lasting generations — let alone one lasting millennia — isn’t really a drought after awhile, but rather just the way things are.
Greenhouse gases represent a modern source of warming that can also drive radiative forcing. That makes the drought conditions in California all the more precarious, as now there’s less need for a change in sun spot activity or the Earth’s orbit to trigger a long-term drought. And, pretty much regardless of what climate policies we adopt over the next several decades, greenhouse gases are likely to increase, which means even greater potential for radiative forcing.
If California does enter another essentially permanent drought, MacDonald sees the state’s entire ecosystem rearranging itself, with forests giving way to grasslands and deserts, lakes drying up, and fires becoming more common. While this wouldn’t mean the end of life as Californians know it, this would mean devoting even more resources to irrigation and other big agriculture engineering projects than the state already does. And even if farming did survive, the current wild ecosystems would likely perish.

Temperatures in the Pacific Ocean
After months of above average ocean temperatures tied to an extremely strong El Niño, researchers say the Pacific Ocean is finally cooling back down. And, while many braced for the possibility of a La Niña event to close out the year and bring even more weather abnormalities, the analysis reveals the onset of such an event is unlikely. A new animation released by Nasa shows how the ocean temperatures have changed since the start of 2015, illustrating the current transition back to a zone that’s neither too hot or too cold.
The forecast comes from the Global Modeling and Assimilation Office (GMAO) and Nasa’s Goddard Space Flight Center. In the past, some El Niño events have been known to be followed by a La Niña, in which deep, cold water moves to the surface. But, the data reveals the ocean temperatures are neutralizing. ‘We are consistently predicting a more neutral state, with no La Niña or El Niño later this year,’ said Steven Pawson, chief of the GMAO.
‘Our September forecast continues to show the neutral conditions that have been predicted since the spring.’ To determine this, the GMAO team used Nasa satellite data along with other information, including aerosols and ozone in the atmosphere, sea ice, winds, sea surface heights and temperatures, and more, to create a seasonal forecast model.
http://www.dailymail.co.uk/sciencetech/article-3791429/Temperatures-Pacific-Ocean-finally-returning-normal-winter-s-powerful-El-Ni-o-Nasa-reveals.html#ixzz4LO3yvNa3

Forbes residents brace for worst floods in a quarter of a century
"Lachlan river, near Forbes, was expected to reach almost 10.7m after the area received an extra 17mm overnight but will peak gently, the BoM senior hydrologist Hugh Bruist said on Sunday."

"About 1,000 people in Forbes were ordered to evacuate on Saturday while residents at Condobolin remain on standby pending possible further flooding."
"The SES has received 2,300 calls for assistance since 30 August, including 95 flood rescues."
"While flooding in Forbes has surpassed the 1990 floods, in which the Lachlan river reached 10.65m, the worst is now being predicted to hit next week."

https://www.theguardian.com/australia-news/2016/sep/25/forbes-residents-brace-for-worst-floods-in-a-quarter-of-a-century#img-1
Unprecedented atmospheric behavior disrupts one of Earth's most regular climate cycles
"The normal flow of air high up in the atmosphere over the equator, known as the quasi-biennial oscillation, was seen to break down earlier this year. These stratospheric winds are found high above the tropics, their direction and strength changes in a regular two- to three-year cycle which provides forecasters with an indication of the weather to expect in Northern Europe. Westerly winds are known to increase the chance of warm and wet conditions, while easterlies bring drier and colder weather."
"The quasi-biennial oscillation is a regular feature of the climate system. On average, these equatorial eastward and westward winds alternate every 28 to 29 months, making them very predictable in the long term. The team's findings published in Science this week, show that this unexpected change in wind direction was caused by atmospheric waves in the Northern Hemisphere."
"A return to more typical behaviour within the next year is forecast, though scientists believe that the quasi-biennial oscillation could become more susceptible to similar disruptions as the climate warms."
https://www.sciencedaily.com/releases/2016/09/160908151118.htm
Saturday, September 24, 2016
Typhoon Megi Headed towards Taiwan

Taiwan
is just having the worst luck the past month, they are destined to be hit by another
Typhoon(Megi) sometime early this week. The conditions are in Megis favors to
gain strength and will be pushed in the direction of Taiwan.
“This track should take Megi toward Taiwan early next week.
The forecast from the Joint Typhoon Warning Center indicates that Megi could
make landfall in southern Taiwan on Monday night or early Tuesday (EDT).
Megi has become a typhoon, and the forecast is for it to
become equivalent to Category 2 or 3 hurricane in strength. Mainland China
could also feel impacts from Megi by midweek.
It looks like it will move along at a steady pace. All interests
in these areas should become aware of the situation and make preparations if
necessary.”
Subscribe to:
Posts (Atom)