Showing posts with label Tania Ortega. Show all posts

Saturday, November 5, 2016

Change afoot? Humid Alabama goes dry, Iran gets extra snowy, Egypt has floods

A deer investigates the shoreline of a receding lake in Alabama as the drought continues.
 A deer investigates the shoreline of a receding lake in Alabama as the drought continues. Photograph: Brynn Anderson/AP
Unseasonably warm and dry conditions, which affected much of the south-east of the US in October, have continued over the past few days.
A wide area from Texas, to Mississippi, Alabama and Florida, has had day-time temperatures reaching into the high 20s and low 30s celsius, with some areas barely getting any rainfall for over a month.
The drought conditions are being caused by a deflected jet stream, carrying moisture and rain further north and allowing high pressure to persist through the south-eastern US.
A storm system accompanied by strong northerly winds brought the first significant cold spell of the season to northern Iran over the past week, particularly to the mountainous province of Ardebil. While snow is not unusual here, the rate at which it accumulated led to disruption to transport and power, and also the closure of schools and public buildings.
In some areas more than 40cm of snow was reported in a 48-hour period and some of this was delivered by thunderstorm activity, causing an unusual combination of lightning strikes and snowfall.
Violent thunderstorms and torrential rain struck parts of Egypt late last week, generating destructive floods. At least 30 people are confirmed to have been killed by the flooding, and more than 70 injured. Large-scale damage was caused to buildings and power supplies. In several settlements neighbouring the Red Sea cars were carried away from land and into the sea by the power of the flood water. The clean-up is expected to take several days.

Climate and Mummies

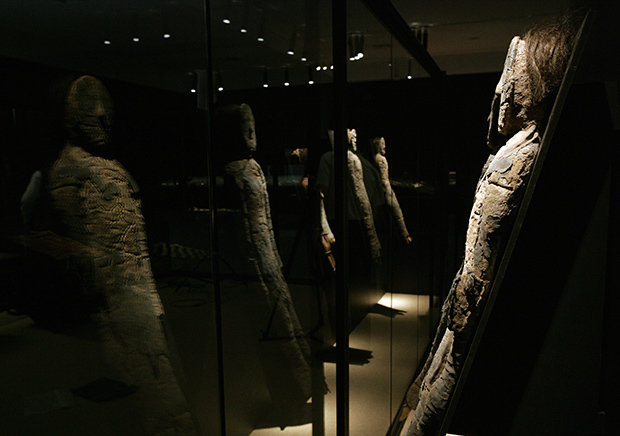
When you think of mummies, you probably think of Egypt. But Egyptian mummies aren’t the world's oldest. The Chinchorro mummies of the high desert of northern Chile and southern Peru are the oldest known man-made mummified human remains. These scientific and cultural treasures have survived largely intact for roughly 7,000 years.

But now, curators at the Universidad de Tarapacá museum in Arica, Chile, are worried. Over the past 10 years, some of the mummies in the museum’s collection—the world’s largest—have started to turn to black ooze.
The leading hypothesis for their rapid degradation is that increasing humidity in the area is boosting the growth and metabolism of bacteria that live on the mummies’ skin.  For mummies still buried in northern Chile, outside of any climate-controlled museum collection, anthropologists fear the problem may be even worse.
The Chinchorro mummies, believed to be up to 1,000 years older than Egyptian mummies, are from the Atacama Desert region of South America. Close to the Pacific Coast, but west of the Andes Mountains, the region is a high plateau with a mild desert climate. Temperatures traditionally range from 64oF (18oC) in the winter to 79oF (26oC) in the summer, and average annual precipitation of less than a ¼ of an inch.
Despite its lack of rainfall, the average relative humidity reaches 70% in places. The high relative humidity is due to the frequent fog that drifts in from the Pacific. The marine fog—which locals call camanchaca—is so abundant that it is tapped for freshwater in some places.  

Why does this matter to the mummies?

Much like everything else in the world, the Chinchorro mummies are covered in microbes. In a paper recently published in the Journal of Cultural Heritage, scientists from Harvard University and the Universidad de Tarapacá said these regular residents and other “opportunistic microbes” could be taking advantage of rising humidity to grow, deteriorating the mummies’ skin as they flourish.

To test the hypothesis, the scientists tested the effects of different levels of relative humidity on tiny samples of the Chinchorro mummies’ skin. They found that high humidity levels allowed the microbes to flourish, and the mummies’ skin turned black and began to ooze, similar to the mummies in the collection.

25 Most Extreme Climates and Places on Earth

Nature can be pretty extreme! In this list, we focus on a variety of different meanings of extreme, namely the five wettest, driest, deepest, coldest, and hottest places on Earth. It’s tough to fathom heat at 160°Fahrenheit (71°C) or rainfall totaling up to seven Big Macs tall in just one day – but it happens! Check out these extreme places in our list of the 25 most extreme climates and places on Earth!
25

Ureca, Bioko Island, Equatorial Guinea – The wettest place in Africa

Equatorial_Guinea_Map
Source: Weather Underground & Daily Telegraph, Image: Wikipedia
Starting off our list are the five wettest places on Earth. The wettest place in Africa is on the southern end of Equatorial Guinea’s Bioko Island. The town of Ureca experiences near-daily downpours, bringing 411 inches (10,450 mm) of rain each year. July alone brings 87 inches (2205 mm) – that’s almost a quarter of annual rainfall in just one month!
24

Cropp River – Wettest Place in New Zealand

Cropp_River,_Westland,_New_Zealand
Source: Weather Underground & Daily Telegraph, Image: Wikipedia
The Cropp River area of New Zealand’s South Island receives 453 inches (11,516 mm) of rain annually, making for a gushing river. Its one-day rainfall record was set on December 28, 1989 when 30 inches (758 mm) fell in 24 hours – that’s almost seven Big Macs piled on top of each other.

USA has the world's most extreme weather

North America — and the USA in particular — has the world's wildest weather extremes: No other part of the planet can boast its ferocious weather stew of hurricanes, tornadoes, droughts, floods, wildfires, blizzards, heat waves and cold snaps.
"You'd be hard-pressed to find another patch of land on Earth the size of the USA that boasts such a variety of such intensely extreme weather inside its borders," says meteorologist and author Robert Henson of Boulder, Colo.
"We get more high-impact weather than any other country on the planet," agrees Sean Potter, a meteorologist and weather historian in New York City.
This wild, varied and extreme weather provides a dramatic backdrop for a new, seven-part Discovery Channel series, North America, which premieres Sunday at 9 p.m. ET/PT. According to Discovery, the series "will reveal the intimate stories of animals struggling to survive in unforgiving weather and rugged terrain."
Filmmakers say that weather plays a huge part in the series. "North America has some of the most extreme weather on the planet — something I'm sure will resonate with a lot of Americans," says series producer Huw Cordey of Discovery.
What makes weather in the USA so wild? It's the contrast of cold, dry, Arctic air and moist, tropical air from the Gulf of Mexico that helps fuel extreme weather, from blizzards to thunderstorms, year-round.

Water temperatures in Gulf could give advance warning of summer tornado activity

Using a combination of observations and models, NOAA-funded scientists have found a small but significant “advanced warning” signal for heightened summer tornado activity in the U.S.: warmer-than-average water temperatures in the Gulf of Mexico. The knowledge has the potential to provide emergency response agencies, communities, and individuals with an early heads up that an upcoming severe weather season may be unusually active.  
These maps show the tornado-Gulf of Mexico connection that researchers found when they divided 30 years of data (1981-2011) into two bins: summers when the Gulf of Mexico was cooler-than-average and summers when it was warmer-than-average. In cool Gulf summers, the amount of energy present in the atmosphere to fuel convection and tornadoes—a key severe weather ingredient, which weather experts call “CAPE”—was reduced (purple colors), and tornado counts in the United States were lower (less reds and oranges). When the Gulf was warm, CAPE was elevated (more orange colors), and tornado counts were higher.
Tornado outbreaks are notoriously hard to predict and right now, scientists can only offer outbreak warnings a few hours in advance. While the authors of this paper are not suggesting that this technique can be used to predict specific storms, it could highlight what conditions are more- or less-favorable for tornado formation—given that today's models do a reasonably good job of predicting Gulf of Mexico temperature anomalies up to 3 months in advance.
“Severe storms threaten lives throughout the United States every year,” wrote the authors. “…any predictive capability is of large societal benefit.”
This research was funded in part by the Modeling, Analysis, Predictions, and Projections (MAPP) program, part of NOAA's Climate Program Office within the Office of Oceanic and Atmospheric Research.
Summer-TornadoGroup_620.png

The mid-October windstorm in the Pacific Northwest

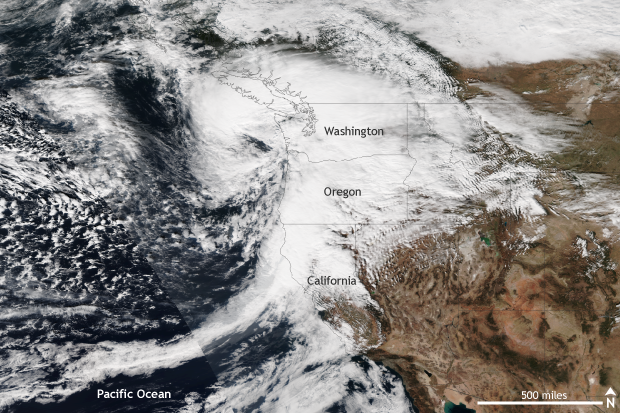
While the forecast for a potentially historic windstorm across the Pacific Northwest over the weekend of October 15-16 did not come to fruition, a strong storm did pass by. Gusty winds and heavy rains caused power outages and fallen trees, but things could have been much worse.
Satellite VIIRS, extratropical cyclone, storm, pacific northwest
A strong extra-tropical cyclone with strong winds and heavy rains impacts the Pacific Northwest on October 15, 2016. Gusty winds toppled trees and knocked out power to thousands. NASA/NOAA image from the Suomi-NPP Satellite provided by the NOAA Environmental Visualization Laboratory. 

It wasn’t the worst-case scenario, but how windy was it?

In the end, the storm tracked slightly farther northwest and offshore than expected, while maintaining roughly the same expected strength – a storm pressure of 969mb. Instead of moving directly inland over Washington, as forecasters initially feared, the storm ended up 30 to 40 miles off the coast. This deviation in track did not mean that the Pacific Northwest was spared completely; it meant that the worst of the storm was offshore.
However, even though the region didn’t face the brunt of the storm as it passed by on October 15, many sites across Washington and Oregon measured strong wind gusts. Along the coast, 70-80mph winds were recorded, and 45-55mph winds were even seen across the Portland Metro area. The highest wind gust observed was a 102mph report at Mary’s Peak at an elevation of four thousand feet. In general, inland areas saw winds between 30 and 40 mph.  As a result, tens of thousands lost power as trees fell and powerlines were knocked down.

Tuesday, October 25, 2016

NOAA awards $44 million for climate research to improve community resilience

NOAA’s Climate Program Office (CPO) has awarded $44.34 million for 73 new projects designed to help advance the understanding, modeling, and prediction of Earth’s climate system and to foster effective decision making.
The projects, ranging from observing systems in the tropical Pacific Ocean to on-the-ground community-based research institutions, will be conducted by NOAA, universities, and other agency and research institutions.
Some anticipated outcomes include more accurate forecasts, early warning hazards of drought, more robust decision support services, enhanced community and drought preparedness, and improved ability to respond and adapt to climate-related public health impacts.
The funds will be distributed over the life of the projects, many of which are multi-year. All awards were selected in an open, competitive process. With these new awards, CPO expands the breadth and scope of NOAA’s climate research, products, and services, and offers opportunities for collaboration within and integration between programs.
“Climate change and extreme events impact individuals, communities, and businesses in the U.S. and around the world. The people grappling with these environmental challenges want timely and relevant information on how climate variability and change affects human and natural systems,” said Wayne Higgins, director of the Climate Program Office. “With these grants, we help advance understanding of the Earth’s climate system, and put information into the hands of those who need it.  Overall, these activities are contributing to healthier populations, sustainable fisheries, resilient inland and coastal communities, and a more robust economy.”

Record-breaking hurricane Matthew causes devastation

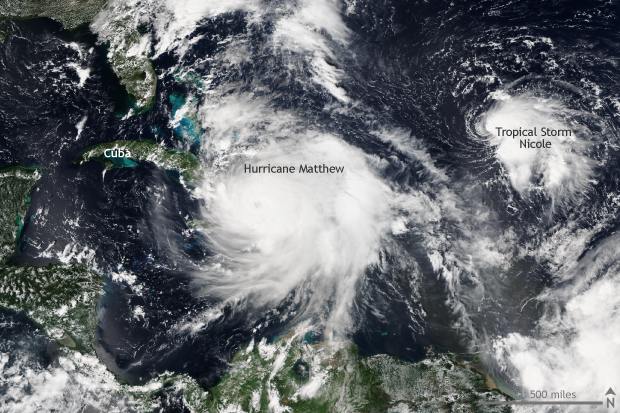
Hurricane Matthew re-wrote the record books across the Caribbean and southeastern United States in early October 2016, leaving behind a trail of devastation. Aided by warm waters in the Caribbean and along the Gulf Stream, Matthew brought strong winds, heavy rains, and high seas to Jamaica, Haiti, Cuba, the Bahamas, and the eastern seaboard of the United States from Florida to Maryland.

Satellite VIIRS, hurricane, Atlantic

Matthew’s origin from normal storm to Category 5 monster

Matthew became a tropical storm close to the Lesser Antilles on September 28, and for several days tracked west as a tropical storm. The storm became named a Category 1 hurricane on September 29. After this relatively slow start, Matthew grew extremely strong, extremely quickly. In the 24 hours after September 30, Matthew intensified from a storm with 80mph winds to a Category 5 behemoth with 160mph winds.
Matthew was the first Category 5 storm in the Atlantic since 2007, and it was the lowest latitude Category 5 hurricane in the Atlantic on record. All of which was even more unusual as it took place in the eastern Caribbean Ocean, a location which has been dubbed a “hurricane graveyard”—a place where low-pressure systems have routinely failed to develop into hurricanes.

What's the hottest Earth's ever been?

Our planet probably experienced its hottest temperatures in its earliest days, when it was still colliding with other rocky debris (planetesimals) careening around the solar system. The heat of these collisions would have kept Earth molten, with top-of-the-atmosphere temperatures upward of 3,600° Fahrenheit.
Even after those first scorching millennia, however, the planet has sometimes been much warmer than it is now. One of the warmest times was during the geologic period known as the Neoproterozoic, between 600 and 800 million years ago. Another “warm age” is a period geologists call the Paleocene-Eocene Thermal Maximum, which occurred about 56 million years ago.

History of hot

Temperature records from thermometers and weather stations exist only for a tiny portion of our planet's 4.54-billion-year-long life. By studying indirect clues—the chemical and structural signatures of rocks, fossils, and crystals, ocean sediments, fossilized reefs, tree rings, and ice cores—however, scientists can infer past temperatures.
None of that helps with the very early Earth, however. During the time known as the Hadean (yes, because it was like Hades), Earth’s collisions with other large planetesimals in our young solar system—including a Mars-sized one whose impact with Earth is thought to have created the Moon—would have melted and vaporized most rock at the surface. Because no rocks on Earth have survived from so long ago, scientists have estimated early Earth conditions based on observations of the Moon and on astronomical models. Following the collision that spawned the Moon, the planet was estimated to have been around 2,300 Kelvin (3,680°F).

What to expect this winter: NOAA’s 2016-17 Winter Outlook

ll we or won’t we see La Niña emerge this year?  Does it even matter?  Shoot, if one of the strongest El Niño episodes in history didn’t deliver much drought relief to California last winter, what are the chances for significant improvement this year?  I’ll attempt to answer these and other questions here in my 5th blog post.

This blog is brought to you by the letter p, for “probability”

So what might influence our climate this winter?  As you know from the ENSO blog, there is a link between the fall and winter conditions across the tropical Pacific and the average winter climate in the U.S. If the likely La Niña develops, certain patterns of temperature and precipitation would be favored across the country. Over the past few years, we’ve discussed the patterns favored by El Niño, but haven’t really discussed what we often see during La Niña winters. Roughly speaking, La Niña impacts are opposite to what is observed during El Niño winters (see the figure).

Sunday, October 16, 2016

4 ways the ozone hole is linked to climate

To mark the peak of ozone hole season, we’re highlighting four ways that climate and the ozone hole are related—and one important way they aren’t. But before you read any further, please take a few moments to enjoy a gorgeous view of the night sky (and an aurora) over the South Pole captured by Patrick Cullis, a NOAA/CIRES scientist who was stationed there from 2008-2009. Antarctica's long months of polar darkness are a key ingredient to the making of the yearly ozone hole, but that doesn't diminish their unique beauty.

Antarctica is the only place on Earth where it's reliably cold enough for an ozone hole to form

The ozone hole is an annual thin spot that forms in the stratospheric ozone layer over Antarctica in mid-September and October. When it comes to the ozone hole, chlorine is the enemy. The chlorine comes from chlorofluorocarbons (CFCs, for short), which were widely used in early refrigeration and cooling systems. Under most atmospheric conditions, when CFCs begin to degrade, the chlorine they contain first gets incorporated into variety of smaller molecules that do not directly harm the ozone layer.

Climate & Lobsters

For New Englanders, the saying “as American as apple pie” may as well be “as New England as lobster.” A summer staple, the tasty crustaceans are served in every conceivable way: boiled, baked-stuffed, on pasta, on salads, or on a roll slathered in butter (just to name a few).
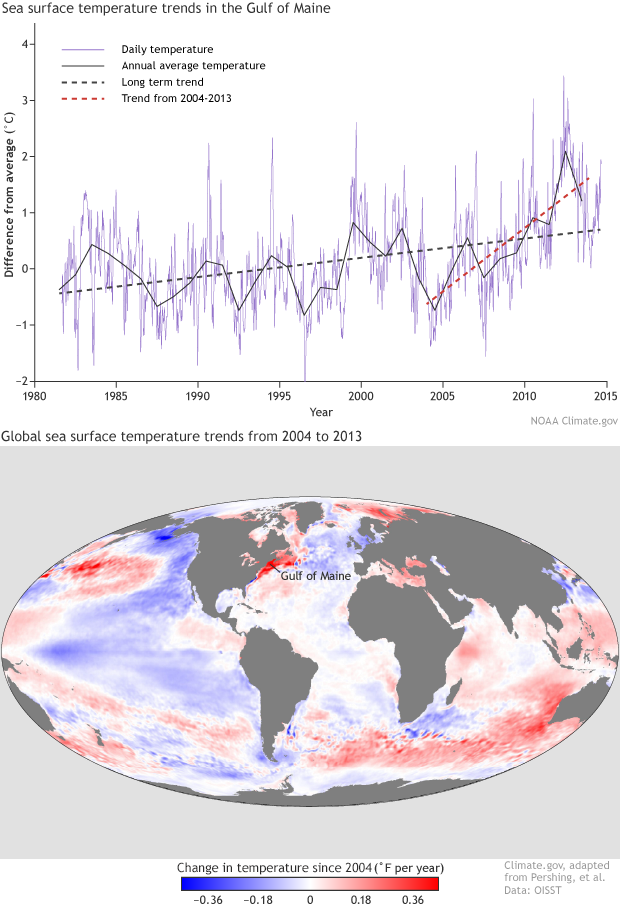
Though it’s as tasty as ever, the lobster on your plate is coming from a different location than it did just 20 years ago. Warming sea surface temperatures from climate change are forcing populations of the American lobster (Homarus americanus) to higher latitudes than ever before—and upending fishing communities on the New England coast. 

Departures and arrivals

The lobster industry in New York and southern New England has nearly collapsed. From 1996 to 2014, New York’s registered lobster landings dropped 97.7%—from 9.4 million pounds in 1996 (the state’s most profitable year) to 215,980 pounds in 2014 (the latest data available). The story is much the same in Connecticut, where landings fell 96.6% from the most profitable year, and in Rhode Island, which saw a 70.3% drop from its most profitable year.
“Former lobstermen in Connecticut, many of whom were formerly fishermen, had to switch to clam and oyster farming. A few are also farming seaweed as a second crop,” Margaret van Patten, Connecticut Sea Grant communications director, said in an email. “They have to be really flexible in adapting to available species.”
This doesn’t mean the actual lobster population is disappearing. In fact, populations are relatively steady; it’s the location that’s changed. While southern New England lobstermen have found increasingly empty traps since the mid-90s, Maine’s lobster fishery has boomed. From 1994 to 2014, Maine’s landings surged 219% to more than 124 million pounds. 

Antici...pation: October 2016 ENSO forecast

What a difference a month can make! Since my last post, the tropical Pacific has changed gears, and now forecasters think there’s a 70% chance that La Niña conditions will develop this fall. However, any La Niña that develops is likely to be weak, and forecasters aren’t quite as confident that La Niña conditions will persist long enough to be considered a full-blown episode, giving it a 55% chance through the winter.

Ch-ch-ch-changes

When I wrote last month, the tropical Pacific wasn’t giving us much evidence that the atmosphere was responding to the slightly cooler-than-average ocean surface, and most of the computer models were predicting that sea surface temperatures would head back toward average.
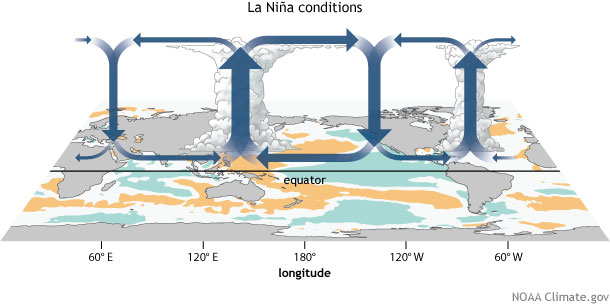
Remember, La Niña (just like El Niño) requires action in both the ocean and the atmosphere. During La Niña, the ocean surface in the central and eastern tropical Pacific gets cooler than normal, leading to sinking air and less rain above that region, just as the waters near Indonesia get warmer and cause more rising air and rain. This stronger Walker Circulation is completed by stronger east-to-west surface winds and west-to-east upper level winds.
walker circulation, ENSO, La Niña, convection, circulation, walker cell, tropical circulation, Pacific Walker Circulation, Pacific Walker Cell
This atmospheric circulation works to enhance the cooler ocean surface, both by blowing across the surface just like you’d cool the surface of your coffee, and also by causing cold water from the deep ocean to rise up. Have you ever blown on the surface of a cup of coffee that has cream in it, but hasn’t been stirred up? You’ll see the cream rise up to the surface, brought there by the circulation you’ve created.

Northwest Passage clear of ice again in 2016

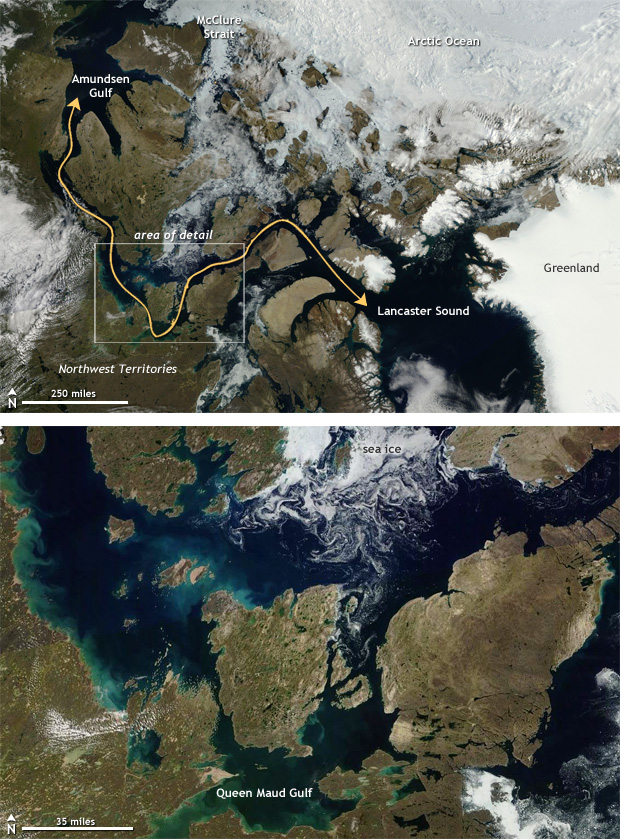
For the last several decades, Earth has had a fever, and it has been spiking in recent years. Nowhere has this been clearer than across the Arctic, where annual average temperature has been warming at twice the rate of lower latitudes. As a result, sea ice has become a dwindling commodity in the far north frequently exposing the southern path through the Northwest Passage—the oft-talked about ship route from the Atlantic to the Pacific Ocean through the Canadian Arctic.


Cloudless skies across the Arctic on August 9 provided a clear view of open water conditions across the straits that make up the Canadian Arctic. Thinner ice and record-low sea ice extents leading up to the 2016 summer melt season plus warmer oceans during the summer led to well below-average amounts of sea ice across the Arctic. Strong storms during August helped break up and clear out the ice along the southern route of the passage. You can draw a line yourself through iceless seas to create your own path, like finishing a real-time geographic maze.
Both the northern and southern routes of the Northwest Passage have been open during occasional years in the past. According to records from Environment Canada, the southern route was "open" (no more than 60% ice covered) occasionally as far back as the 1970s, and the northern route was open in the summer of 1998—a record-warm year at that time. But since roughly 2006, the southern route has been navigable in the summer almost yearly. The northern route was open in 2007, 2008, 2010, 2011 (which was a record-low ice year), 2012, 2015, and now, in 2016 as well.

Tuesday, October 4, 2016

18 Insane and Unusual Weather Phenomena's That Are Actually Real

You can hardly believe these strange and unusual weather phenomena's are actually real. Some of the you will be familiar with, whilst others will leave you amazed. Our favourite is the Catatumbo Lightning that occurs at the Catatumbo River in Venezuela.

1. Frost Flowers in the Arctic Ocean
insane weather frost flowers
insane weather frost flowers 1
Photo by Jeff S.Bowman
These frost flowers in the Arctic ocean form from imperfections on the surface of the ice in sub-zero temperatures, normally around the -20C mark. The spikes have been found to contain microorganisms making them temporary miniature ecosystems similar to coral reef.
2. Brinicle
brinicle 1
brinicle 2
Photo via huffingtonpost
First discovered in the 1960's a brinicle forms below sea ice when a flow of very cold saline water meets an area of ocean water forming the equivalent of an underwater icicle.