Showing posts with label Matt Schulte. Show all posts

Tuesday, December 9, 2014

California Flood Threat: Pineapple Express to Bring Heavy Rain, Sierra Snow, High Winds (FORECAST)

Thanks to an atmospheric river known as the Pineapple Express, more soaking rain and mountain snow is on the way for California, the epicenter of the nation's most widespread exceptional drought.
Last week, Los Angeles County dams and spreading ground captured 1.8 billion gallons of water, enough to meet the needs of 44,000 people in one year. That's a relative drop in the multi-year drought bucket, but a start.
While this all sounds like good news, more flooding, rock/mudslides, debris flows and even damaging winds are possible with this upcoming storm. The National Weather Service in Monterey, California, said Monday that this storm is "expected to be one of the strongest storms in terms of wind and rain intensity" since storms in October 2009 and January 2008.
Storm Setup
Enlarge
Storm Setup
Forecast depiction of the "Pineapple Express", a plume of deep moisture that will be directed into the West Coast this week.

    Setup: An Atmospheric River

    What has finally opened the door to drought relief in California?
    Last winter, the Pacific jet stream was diverted well to the north of the U.S. West Coast by blocking high pressure in the upper-levels of the atmosphere.
    Now, an energetic Pacific jet stream will point squarely over the West Coast this week. This Pacific jet will tap a narrow, deep plume of tropical moisture over 3,000 miles long known as an atmospheric river. 
    According to NOAA's Earth System Research Laboratory, these atmospheric rivers (ARs) are important:
    - About 30-50 percent of annual precipitation in the West Coast states occurs in just a few AR events.
    - The strongest ARs can transport as water vapor up to 15 times the average flow of liquid water at the mouth of the Mississippi River, triggering flooding when stalling or making landfall.
    In this case, an AR known as the Pineapple Express, so named due to the origin of the moist plume in the central Pacific Ocean near Hawaii, will slide down the West Coast through the week, wringing out the heaviest rainfall from western Washington to northern California.
    Wednesday's Forecast
    Enlarge
    Wednesday's Forecast
      Thursday's Forecast
      Enlarge
      Thursday's Forecast
        Model Rain and Snow Forecast
        Enlarge
        Model Rain and Snow Forecast
        The map above shows a forecast model rain and mountain snow forecast through Friday. The heaviest rainfall is expected in areas shaded in yellow and orange.

          Forecast: More Heavy Rain, Flooding

          While an initial round of rain will soak primarily parts of western Washington through Tuesday, the bulk of the heavy rain event will arrive on the West Coast beginning Wednesday.
          A band of heavy rain accompanying the initial cold front will sweep ashore from western Washington to northwest California during the day Wednesday.
          Wednesday night and Thursday, the Pineapple Express will sag slowly south through northern and central California as the southward dip in the vigorous Pacific jet stream swings into the Golden State. 
          It's at that time that the heaviest rain and, therefore, highest threat of flash flooding will be in play in those areas.
          Late Thursday night and Friday, the weakening atmospheric river and corresponding southward dip in the jet stream will swing over Southern California, providing a quick burst of rain for the Southland in time for Friday morning's rush hour.
          (FORECAST: Los Angeles | San Diego)
          Overall, the heaviest rainfall totals are expected from western Washington to northern California, with numerous 3-to 5-inch rainfall totals expected. This includes much of the San Francisco Bay Area and Sacramento. Locally higher amounts of up to 8 inches, or more, can be expected in the Sierra foothills below snow level, the coastal ranges and windward locations of the Olympic Mountains.
          Flash flooding, mud/rockslides and debris flows are most likely in these areas, particularly given saturated ground from last week's soaking.
          In fact, the National Weather Service in Monterey, California mentioned the last time the city of San Francisco picked up a four-inch-plus rainfall total in two days or less was on Feb. 3, 1998, during a strong El Nino, no less. (There is no El Nino, as yet.)
          Over an inch of rain is possible in parts of Southern California late Thursday into Friday, particularly in the L.A. Basin. While these totals are not nearly as impressive, they may be sufficient to produce additional debris flows in burn areas, and may prompt more evacuations.
          Wind Watches and Warnings
          Enlarge
          Wind Watches and Warnings

            Other Impacts

            Winter storm watches have been hoisted for parts of the Sierra above 5,500 feet, where 2 to 3 feet of snow (and locally more) may pile up from Wednesday night through Friday.
            (INTERACTIVE: Winter Alerts)
            These snow levels will be at least 1,000 feet lower than last week's storm, so the impact to drivers could be much greater. Travel over the Sierra will become hazardous and some passes may close for a time Thursday, as heavy snow whipped by wind gusts of 60 mph or higher may produce blizzard conditions.
            In lower elevations, occasional wind gusts over 50 mph are possible Wednesday night through Thursday night from northern California and southwest Oregon shifting south along the central California coast into the San Joaquin Valley.
            High wind watches have been posted for a number of areas, including the city of San Francisco. The last time a high wind watch was posted for San Francisco proper was Feb. 5, 2012.

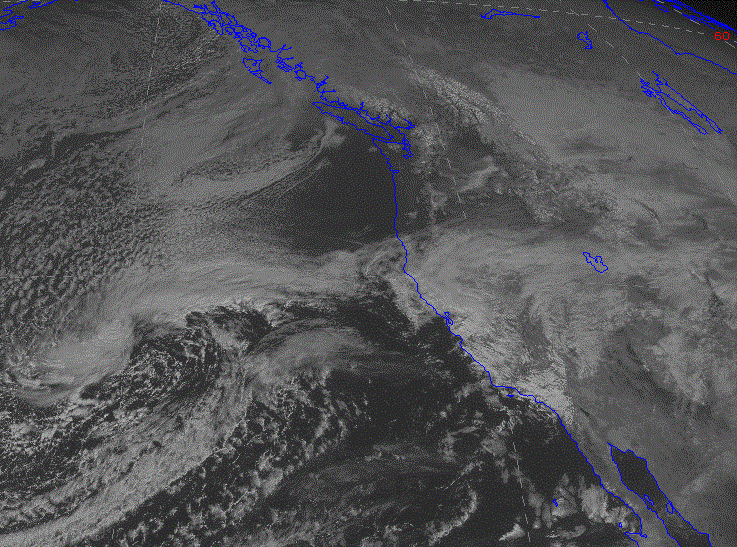
            Northwest Cold Wave is California's Salvation

            When sustained cold air moves into the Northwest, the frontal zone separating cold and warm air shift southward into California.   The temperature difference between the two air masses is associated with the jet stream, so it usually heads south at the same time.  Fronts bring clouds and rain.  So does the jet stream.   In short, with cold air dominating the Pacific Northwest, the frontal weather action and jet stream related storms head to California.

            OUR clouds and precipitation are being sent down to those poor folks in drought-plagued California.  They desperately need the precipitation.  And we need the late fall sun. 

            Let's take a look at this grand exchange, by starting with the visible satellite image this afternoon.
            Pretty much clear in Oregon and Washington, but California is enshrouded.  Good to see.


            The 7 PM Sunday surface chart shows the situation.  High pressure over us and a frontal band bisecting California.

             The 24h rainfall totals ending Sunday at 9 PM show the respectable totals around much of the Golden State. Over 1.5 inches near the coastal mountain SW of San Francisco and .5 -1 inches over much of California's mid-section...the most extensive rain they have had since last year.


            Here is the storm total (last two days) from the San Francisco radar--lots of areas got 1-2 inches!


            Californian's are seeing something there are not used to:  rainbows.  Perhaps a sign from providence that their suffering is ending.


            And yes, the weather gods seem to be taking a liking to CA folks.  Let's take a look at some upper-level (500 hPa) maps, starting with Tuesday evening.  A closed low off CA, with strong flow (lines close together) heading into central and southern CA.
            4 AM Friday?  A trough offshore and moist southwesterly flow heading into CA.  You can bet on precipitaton.
             The WRF model precipitiation forecast for the next two 72h periods shows California getting moisture, with nothing over Washington State for the first 3 days.


            They need a lot more than this, but a good start. This is an weak to moderate El Nino year, and El Nino years (particularly strong ones) bring enhanced rainfall to southern CA.  The latest NWS Climate Prediction Center 3-month precipitation forecast is going with that idea. 


            This event is literally a drop in the proverbial bucket for California, but it is a welcome first step, considering the historic drought hitting that state.

            Beware of Bridges

            Icy danger awaits on bridges these days. 

            While most roadways in contact with the earth have remained ice free, bridge icing has occurred all over the region.  Yesterday, as I headed down to the Burke Gilman trail I was greeted by a very, very slippery bridge where another bicyclist had crashed the day before. No ice before or after the bridge.

            Heading south on the trail, trying to avoid the deep ruts and root heaves, I came to the bridge over 35th Ave NE.  Totally iced up and dangerous.  A bike skidded right in front of me.


            Why are the bridges icing up when roadways and paths in contact with the earth are not?  Because the earth is still relatively warm.

            Here are the latest soil temperatures at 8 inches below the surface from the WSU AgWeatherNet website.  The subsurface soil was in the upper 30s F over western Washington, near freezing in eastern Washington.  40s in the Willamette Valley and along the coast.


            A few days ago the soil was even warmer after the extended warm period in mid-November.  So roadways in contact with the soil are getting a lot of heat conduction from below.  Bridges don't have that...the air underneath them acts to insulate them from the ground.   On clear nights, the bridges radiate heat to space in the infrared and quickly cool without heat coming up from below.   

            I have done some forensic meteorology work and the number one type of lawsuits is associated with roadway icing, with bridges being the main locations of the accidents on cold, clear nights and during the subsequent morning hours.  Many times the cars skid on the bridge and overturn or crash on the other side. Bridges te on curved roadways are particularly dangerous.

            Perhaps the most tragic case involved some folks who crashed on the elevated 405 bridge cloverleaf near Woodinville during an icy night..  They got out of their damaged car and worried they would be crushed by other skidding vehicles. One individual jumped off the bridge, thinking it was just off the ground.  He didn't survive the fall.

            Tuesday night it was happening again.  Here are the temperatures around Seattle, both over ground and on bridges, around 9:30 PM.  The temps in rectangles are from road sensors, the others are air temperatures, generally about 6 ft above the surface. Look at the lower left corner...you see the two 35s?  Those are on the West Seattle bridge, whose temperature is already a few degrees lower than surround air temperatures. There are other bridges with a similar situation and it will only get worse the rest of the night.

            Let me show that.  Here are the observations at 5:35 AM the next (Wednesday) morning. The West Seattle bridge has reached freezing, while the surrounding observation were 36.  Look at the bridge temperature on the viaduct near the UW (the 30F in the NE quadrant for those not from Seattle)....substantially colder than nearby temps.

            We are very fortunate that city of Seattle invested in roadway temperature sensors and the collection of all the weather data over the city.  I suspect they will be checking and treating the bridges tonight to ensure safe travel tomorrow morning.   WSDOT has also invested in roadway sensors and their personnel understand the threat of icy bridges, something that was not true 30 years ago.  

            How long will the cold temperatures last?  Not long.  We are near the end of the cold period and there may not be any freezing temperatures for many of you in western Washington for at least a week. But this is a Faustian bargain...we will give up the sun and get some rain in return.

            Is a Major Windstorm Headed for the Northwest?

            For the last few forecast cycles, the U.S. global model, the GFS, has been predicting that a very strong Pacific storm will develop off of northern California and then slam into the Pacific Northwest on Thursday.

            But there were reasons to be wary about this forecast.  The European Center model, which is usually superior to the U.S. GFS, had no such strong cyclone.  Other modeling centers have found different solutions from the GFS (weaker storm) Furthermore, the U.S. model had the position and intensity of the system varying substantially.

            But tonight's forecast is highly consistent with those made earlier today, and the forecast solution of other major centers, such as the UKMET office are now doing something similar. 

            Finally, we are now only 48h out and it is unusual to have major forecast failures at that time range. But it is also unusual for there to be such major discrepancies between major models this close in.

            Let's start by looking at the latest sequence of 12-km UW WRF runs, driven by the National Weather Service GFS model. These are surface charts with the lines being pressure lines (isobars).

            10 PM Wed. you see a 982 hPa (mb) low off of northern CA

             By 4 AM Thursday it had deepened (975 hPa).  That is a very deep low center for our neighborhood.
            Intense pressure difference (gradient) to the south and east of the low.  Big winds.

             By 10 AM Thursday the low had weakened a bit (976 hPa) and hurricane-force winds are hitting the northern Oregon coast.   This is very serious stuff.

             And then the system weakens substantially as it crosses Vancouver Island Thursday afternoon (4 PM is shown). Strong winds over Puget Sound (30-50 mph gusts perhaps)

            Just a small shift in the storm or how it revs up could greatly change the details of this forecast, so PLEASE keep this uncertainty in mind.

            Take a look at the model wind gust forecast for 8 AM on Thursday.  How many ways can you say amazing?  75 knot gusts and more.  We are talking about power outages and damage on the Oregon coast.


            The UK MET office model, which is the second best in the world, is now going for a storm, but a weaker one.  Here is the forecast for 4 PM Thursday.  A 983 hPa low on the WA coast.   A bit different solution and not as strong.


            The Canadian Meteorological Center (CMC) GEM model, the fourth best in the world is NOT producing a storm:

            At the same time, the European Center model, normally the most skillful, has weaker low center  (988 hPa) over SW Washington (shading is relative humidity, solid lines are pressure)


            This is a small storm, with substantial uncertainty remaining, but we need to watch it carefully.  But tomorrow night we should have much more confidence about what will happen.

            And we should not forget the HUGE amount of rainfall that will fall in the next 72 hr ( see forecast). 5-10 inches in the Olympics, on Vancouver Island, and the southern Coast Mountains.  Huge amounts in norther CA.


            As a result, the NWS River Forecast Center is going for flooding on several western WA rivers, some reaching moderate flood levels.  And there is the potential for some landslides.

            Why Hasn’t A Major Hurricane Hit the U.S. in 9 Years?

            Another Atlantic hurricane season has come to a close, and with it comes the continuation of a remarkable streak: The U.S. hasn’t seen a major hurricane make landfall within its borders in nine years. The last to do so was Hurricane Wilma, which hit Florida as a Category 3 hurricane on Oct. 24, 2005.
            The tracks of all hurricanes that reached major hurricane status (Category 3 or higher) in the Atlantic Ocean basin from the 2006 through 2013 hurricane seasons.
            Click image to enlarge. Credit: NOAA
            Yes, Sandy ripped over the East Coast to the tune of $70 billion in damage in 2012, but it was technically an extratropical system by the time it slammed into New Jersey, with wind speeds equivalent to a Category 1 hurricane. Major hurricanes are those of Category 3 or higher, a ranking based only on wind speeds.
            The drought of major hurricane hits is unmatched according to records stretching back to the 1950s. And its reason is a mystery.
            Experts chalk it up to chance, rather than any identifiable climate pattern or the effect of global warming. After all, major hurricanes have raked Mexico and many Caribbean countries in that nine-year interval. Even Sandy was a major hurricane when it hit Cuba.
            “Other people have been bearing the brunt,” Gerry Bell, the lead seasonal hurricane forecaster for the National Oceanic and Atmospheric Administration (NOAA), said. “We’ve just been fortunate.”

            Chance Weather

            A hurricane’s development and path are determined by many factors, including the immediate weather patterns present when a hurricane forms. Those are responsible for at least some of the recent lull, Bell said.
            “One of the factors that we’ve been seeing for about five years now is a stronger upper level trough (or low pressure area) over the U.S., and that has helped redirect them out to sea,” he said.
            In contrast, the incredibly active and devastating 2005 season had a ridge, or high pressure system, over the same region. “That’s when you get these very long westward tracks,” that can impact the U.S., Bell said.
            The problem is those patterns are not easily predictable. So while forecasters can deduce the number of storms expected at the beginning of a hurricane season, they are not able to predict where they will hit.
            Hurricane Wilma seen by satellite as it crossed Florida in October 2005. Wilma was a Category 3 storm when it made landfall in the state and is the last major hurricane to hit the U.S. since that time.
            Credit: NOAA/NASA
            Why we’ve had this pattern over at least some of the past nine years, and why the lull has lasted so long isn’t a question scientists can really answer right now.
            “I think it’s interesting that it’s gone on this long, but I think that it’s probably some kind of variability,” Gabriel Vecchi, a climate researcher at NOAA’s Geophysical Fluid Dynamics Laboratory in Princeton, N.J., said “It’s just the weather we happen to have gotten.”
            Vecchi said that while there is very little in the way of explanation, not much points to climate change as a reason.
            “I would be surprised if we found if this was due to greenhouse gases,” he said.

            Warming and Cyclone Tracks

            But even if warming had nothing to do with the recent lull in major hurricane landfalls, that doesn’t mean it might not affect hurricane tracks in the future. And climate scientists can say a lot more about the future effects of warming than about what role warming might be playing in current events.
            Vecchi helped conduct a modeling study that looked at how warming might affect hurricane tracks, specifically in the Atlantic Ocean basin. What he and his colleagues found was a shift of storm tracks toward the eastern part of the basin (the same shift is seen with El NiƱos, he said) because of changes to particular atmospheric patterns that affect the storms, such as the Bermuda High, a semi-permanent high pressure area off the East Coast of the U.S..
            Computer models aren’t the only evidence of this shift. Vecchi and his GFDL colleague Tom Knutson have also looked at the observational record and found a similar eastward shift over the past 50 years, even when changes in how hurricanes are observed and reported are taken into account.
            “So there seems to be some evidence in observations and some model studies that maybe storms would shift eastward in the Atlantic as the planet warms,” Vecchi said.
            The blue and purple square in the above figure represent a decrease in hurricanes and the red and orange squares an increase. The graph below that shows the apparent decline in hurricanes in the western Atlantic and the increase in the eastern Atlantic.
            Click image to enlarge. Credit: Journal of Climate, Vecchi and Knutson
            Other work has come to conflicting conclusions. A study by Jennifer Francis of Rutgers University has suggested that the reduction of Arctic sea ice and the amplified warming at the North Pole could lead to more “blocking situations” like the one that sent Sandy on its westward turn into the U.S. Blocking patterns happen when the kinks in the jet stream get “stuck” for several days or weeks.
            But that idea is a contentious onein climate circles. And other research, including work by Adam Sobel, a hurricane modeler at Columbia University’s Lamont-Doherty Earth Observatory, has suggested that warming will lead to the opposite situation, with fewer blocking events and more southerly hurricane tracks.
            Even if the research were conclusive, however, it provides little guidance over the short term. Climate trends happen over long time frames, and are not terribly useful in figuring out if the hurricane-less streak will end next year or in the next decade. And they don’t mean the U.S. is safe from hurricane strikes now.
            Vecchi said he and his friends were recently marveling at how just 10 years ago they were wondering if devastating impacts like those from Katrina and Rita were going to be the new normal. And then the streak began. The lesson? “Let’s not be so short-sighted,” Vecchi said.