Showing posts with label Rachel Popa. Show all posts

Sunday, October 30, 2016

Chicago Bracing For Heavy Snowfall, Frigid Temps This Winter: Report


This coming winter had a chilling effect on today's City Council budget hearing.
Streets and Sanitation Commissioner Charles William said during the meeting the department is preparing for 16 inches of snow that could start falling as soon as Thanksgiving, the Chicago Sun-Times is reporting.
William also reportedly told the council temperatures will be lower than normal in January and February.

“It’s going to be a bad winter,” the newspaper reported Williams as saying.
This year's El Nino is one of the strongest on record and it could have a big impact on winter weather across the nation, according to the latest forecast models.

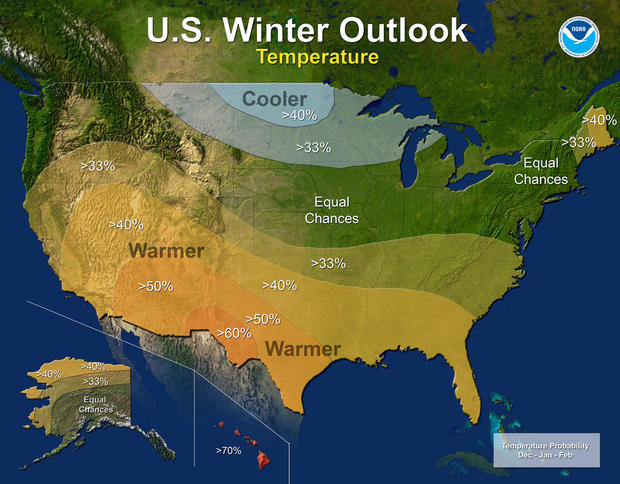
Despite predictions that the Chicago area will see another frigid winter this year, it appears El Nino could bring warmer than usual temperatures to the area during the winter months.
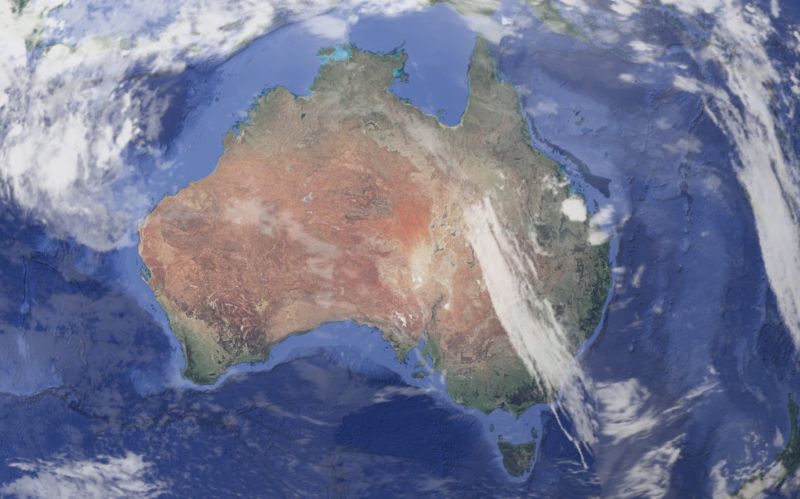
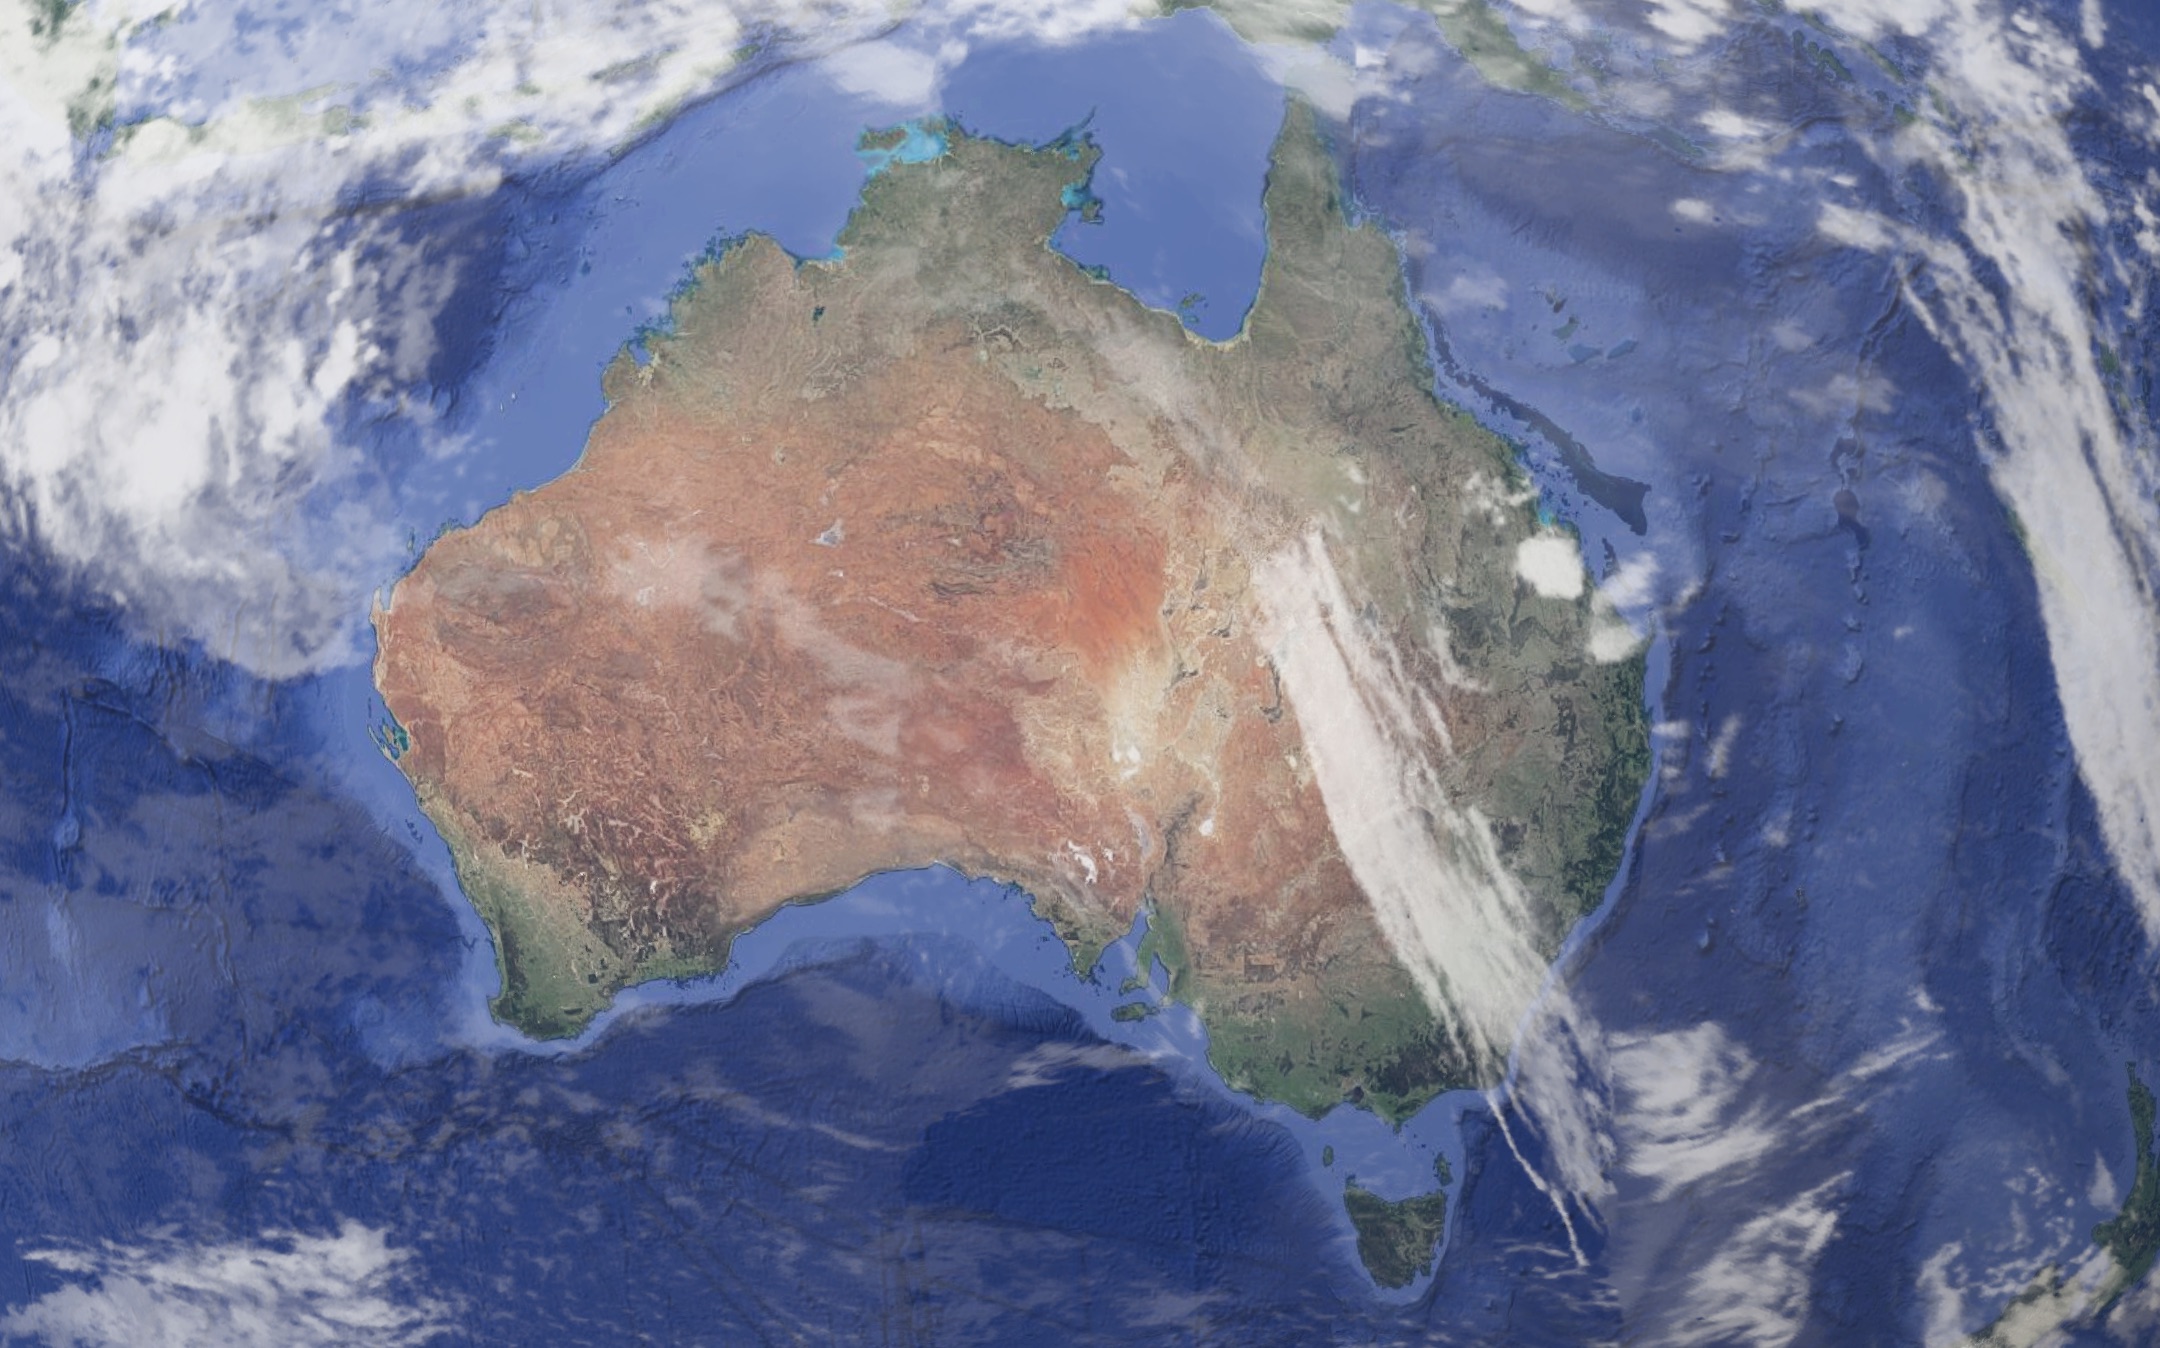
El Nino is characterized by unusually warm sea surface temperatures in the Pacific Ocean along the equator. The shift in temperatures could cause a change in weather patterns thousands of miles away – including in Chicago.

Forecasts from the National Oceanic and Atmospheric Administration predict the weather phenomenon will continue in the Northern Hemisphere through the winter, peaking in the late fall-early winter months. The event will likely weaken by spring of 2016, forecasters said.

The National Weather Service Climate Prediction Center reported Illinois has an increased chance for above-average temperatures and below-average precipitation for the months of December, January and February.
That doesn’t mean area residents won’t need their winter coats and snow shovels, however.
According to the state climatologist, other factors come into play when determining the winter weather and even a mild winter can contain short periods of intense cold and heavy snow.

"While temperature and precipitation impacts associated with El Niño are favored, El Niño is not the only player," Mike Halpert, deputy director of NOAA's Climate Prediction Center, said in a statement. "Cold-air outbreaks and snow storms will likely occur at times this winter. However, the frequency, number and intensity of these events cannot be predicted on a seasonal timescale."
Last month, the Old Farmer’s Almanac predicted frigid weather in the Midwest this winter season.

Source: City Bracing For Heavy Snowfall, Frigid Temps This Winter: Report | NBC Chicago http://www.nbcchicago.com/news/local/chicago-winter-snow-398954931.html#ixzz4Oby8h1NH

President Obama Orders Government to Plan for 'Space Weather' Chaos

Turning his attention to the heavens — and how turbulence there could create chaos on Earth — President Obama directed the federal government Thursday to come up with a plan to deal with "space weather." 
Space weather, by the way, is a catch-all for disturbances in the area between the sun and Earth, such as solar flares, that wreak havoc on the electrical power grid, GPS systems, aviation equipment, satellites and other technology that have become integral to human life. 

Image:

The Aurora australis, also known as the southern lights, glows above the Earth on July 15, 2012. Joe Acaba / NASA via AP

Particularly bad storms of this kind can bring down parts of the power grid, "resulting in cascading failures that would affect key services such as water supply, healthcare and transportation," according to an executive order Obama signed Thursday. "Space weather," the order adds, "has the potential to simultaneously affect and disrupt health and safety across entire continents." 
The directive put several federal agencies on notice that they have six months to come up with a sweeping plan to predict and detect these interstellar events, alert the public, protect critical infrastructure and recover from the damage. That includes NASA, which will create a research program to "understand the sun and its interactions with Earth and the solar system. The president signed the order as he prepared for a daylong Frontiers Conference in Pittsburgh, where he planned to announce $300 million in spending on a variety of projects aimed at keeping the United States on the edge of technological innovation over the next 50 years, from understanding Alzheimer's disease and road traffic to preventing biased policing to putting a person on Mars.

(Source)

Be aware of these 5 fall weather trends

Fall's reputation for clear, calm days doesn't always hold true. This can particularly be the case later in the season for some parts of the country.
Given it's a transitional time of year, there can be a little taste of everything: snowstorms, tornado outbreaks and even hurricanes. Here are five fall weather threats that are possible each year.

1.) A Second Tornado Season

The greatest chance of tornadoes in November is near the Gulf Coast.
The second half of October and especially November can often be a second season for tornadoes and severe thunderstorms.
With cold fronts and jet stream winds becoming stronger in the fall and warm, moist air available at times, the atmosphere can become unstable. As a result, severe thunderstorms with damaging winds, large hail and sometimes tornadoes can develop.
Most of the time, the second-season tornado outbreaks are in the Gulf Coast states where warm and moist air is more common, but they can sometimes spread farther north.
One such outbreak that occurred well away from the Gulf Coast occurred on Nov. 17, 2013. On that day, damaging tornadoes touched down in several Ohio Valley and Great Lakes states.
The largest fall tornado outbreak struck the South Nov. 21-23, 1992. A total of 105 tornadoes touched down in the three days, killing 26 people.

2.) 'November Witch' Storms With Strong, Damaging Winds

Strong low pressure system that affected the Great Lakes on Nov. 12, 2015 with high winds.(NOAA)
As temperature contrasts increase from north to south across the country, storm systems that develop are stronger in fall. The more intense those low pressure systems become, the stronger the winds they can produce.
Early November – and late October, for that matter – have a long, notorious history of intense Midwest windstorms. If you live in that region of the country, you may have heard the phrase "witches of November" used to describe these storms that often pack powerful winds.
Those low pressure systems can have winds so strong that they cause tree damage and power outages. One such "November Witch" struck parts of the Midwest and Great Lakes in early November of last year, downing trees and causing power outages.
The storms are also a major hazard for shipping on the Great Lakes. One of the most well known storms sank a huge iron-ore ship called the Edmund Fitzgerald while it was on Lake Superior in November 1975.

3.) Wet Snow

Big snowstorms in fall can sometimes be destructive.
The heavy, wet nature of most early-season snowfalls can weigh down tree branches and power lines, causing them to break.
Also playing a role is the fact that many trees may still have their leaves, adding extra weight to branches already being weighed down by snow.
Add the force of strong winds to this, and you could have a widespread mess of downed trees and power outages, sometimes lasting for days.
One such storm dubbed "Snowtober" struck the Northeast Oct. 29-30, 2011.
Satellite image from Oct. 30, 2011, showing the swath of snow produced by Snowtober from West Virginia to southern New England.(NOAA)
This rare, major October snowstorm dumped more than a foot of snow from northeast Pennsylvania to southern Maine. Incredibly, parts of Massachusetts and New Hampshire saw more than 30 inches.
Trees were damaged and power lines were downed by the heavy, wet snow, causing more than 3 million to lose power. In some of the hardest hit areas, power was out for more than a week.

4.) Santa Ana Winds 

Typical Santa Ana setup.
Fall is the time of year when Santa Ana winds make a return to Southern California. These wind events are most common September through March.
Strong high-pressure systems that build into the interior West help to send offshore winds from the northeast or east through the canyons and passes located in the mountains of Southern California.
These wind events can have several impacts on Southern California, including:
  • Low humidity levels, which makes the danger of wildfires high.
  • Wind damage that can fan any ongoing wildfires.
  • Wildfire danger is typically the highest in the fall because the vegetation is dry since Southern California is coming out of its summer dry season.
  • The air that descends after passing over the mountains compresses and warms up, resulting in warmer-than-average temperatures in the valleys of Southern California. This is the reason why temperatures have been as hot as the upper 90s and even near 100 degrees into early November in Los Angeles.

5.) Hurricane Season Comes to a Close, But You Can't Let Your Guard Down Yet

Hurricane Wilma makes landfall in southwest Florida on Oct. 24, 2005.(NOAA)
As we saw with Hurricane Matthew in early October, the hurricane season still needs to be closely watched in October and into November,
In recent years there have been disastrous hurricanes impact the U.S. in late October, including Sandy in 2012 and Wilma in 2005.
Though exceedingly rare, three hurricanes have struck the U.S. in November. In 1985, Hurricane Kate made landfall in Florida just days before Thanksgiving.
November as a whole averages about one named storm every two years in the Atlantic.
The Atlantic hurricane season officially ends Nov. 30, but tropical storms and hurricanes can still develop even after that date.

How does 2016's World Series forecasted weather match up with 1995 and 1997's?

CLEVELAND, Ohio – The Indians made it to the World Series, Cleveland! The first time since 1997. Game 1, this Tuesday, Oct. 25, is forecasted to be in the mid 40s, with thankfully near zero rain chances.
What's the weather for Cleveland Indians World Series Game 1 and Cavaliers opener on Oct. 25?
Meteorologist Kelly Reardon takes an early look at the weather expected for Game 1 of the World Series and the Cleveland Cavs season opener on Tuesday, Oct. 25.

So, wear a warm coat, bring your Tribe hats and gloves, and give thanks that the weather is better than the chilly World Series in 1997.
Screen Shot 2016-10-24 at 9.09.38 AM.pngNote: All temperatures are from first pitch. Red denotes home games, grey denotes away games. Games 5, 6, and 7 of this year's World Series are pending on the results of Games 1 through 4. 
1995: The games played in Cleveland against the Braves were definitely pretty warm for late October, in the 50s with no rain. Talk about perfect game weather for both fans and players!
1997: The games played in Florida were obviously very toasty compared to Cleveland, in the mid 70s to 80s. Here in 1997, games 3 and 5 weren't bad, in the high 40s to 50s. It was game 4 that was notably chilly, with game temperatures starting at 41 degrees which dropped to the mid 30s - burr!
For the fans, the game was spent bundled up head to toe with star-struck eyes peeping between their scarves and hats.
BALTA  SNOWDENBaltna Snowden, of Wooster, Ohio, is bundled up from the cold as she waits for the start of Game4 of the World Series at Cleveland's Jacobs Field, Wednesday, Oct. 22, 1997. Temperatures at game time were in the 30s with snow flurries.  
2016: This year, we're looking quite a bit warmer than in 1997, making it much easier to cheer in the stands! The first two games' start temperatures are in the mid 40s -- definitely doable.
However, Tuesday it's looking there will be some rain, so that'll make it a bit harder for the players, but if you're lucky enough to be in the stands, definitely bring a rain coat.
If games 6 and 7 occur, they'll be in Cleveland, in the mid 50s with only slight chances of rain for now.

How bad is this winter's weather going to get?

WASHINGTON -- Federal forecasters predict this winter may paint the U.S. in stripes of different weather: Warmer and drier than normal in the south, and colder and wetter than usual in the far north.
The National Weather Service winter outlook, issued Thursday, gets murky in the nation’s middle belt, with no particular expectation for trends in temperature or precipitation.
Still, some nasty storms might make the winter there memorable, said Mike Halpert, deputy director of the weather service’s Climate Prediction Center.
winteroutlook1.jpg
This map provided by NOAA shows the winter temperature outlook for the U.S. 
 NOAA VIA AP
The major driver of the winter forecast is a budding La Niña, a cooling of the central Pacific that warps weather worldwide and is the flip side of the better-known El Niño, Halpert said.
For the South and California, “the big story is likely to be drought,” Halpert said.
And that’s not good news for California, which is in year five of its drought. The winter is the state’s crucial wet season when snow and rain gets stored up for the rest of year. Halpert said the state’s winter looks to come up dry, especially in Southern California.
“It’s probably going to take a couple of wet winters in a row to put a big dent into this drought now,” said weather service drought expert David Miskus. He said it will take “many, many years and it’s got to be above normal precipitation.”
The northern cold band that the weather service predicts is mostly from Montana to Michigan. Maine is the exception, with unusually warm weather expected.
The prediction center’s track record on its winter outlooks is about 25 percent better than random chance for temperature and slightly less than that for precipitation, Halpert said.
Private weather forecasters are predicting quite a different winter. They foresee a harsher one for much of the nation, including a return of the dreaded polar vortex, which funnels cold Arctic air into the U.S.
Judah Cohen of Atmospheric and Environmental Research in Lexington, Massachusetts, forecasts an unusually cold winter for the eastern and middle two-thirds of the nation, especially raw east of the Mississippi River.
Cohen, whose research is funded by the National Science Foundation and closely followed by meteorologists, links North America’s winter weather to Siberian snow cover in October.
He agrees that Maine will have a warm winter, and also predicts a warm Southwest.
The private Accuweather of State College, Pennsylvania, calls for frequent storms in the Northeast, early snow in the Great Lakes, bitter cold in the northern tier and occasional cold in the middle. Like other forecasters, it predicts a warm and dry southwest, with some hope for rain and snow from San Francisco northward.

Extreme weather could be putting your favorite bottle of wine at risk

spilt wine
Global wine production is forecast to fall 5% in 2016, making it one of the worst years since the start of the century, according to the International Organization of Vine and Wine (OIV). 
Wild weather, apparently driven by climate change, is the main culprit for the decline, the wine group says
"With global warming, we're witnessing an increase in exceptional events that are more frequent, longer lasting and of greater scale," Jean-Marie Aurand, the head of the OIV, told Reuters. 
Huge drops in output are expected this year in key South American nations including Chile and Argentina. 
Known for producing popular red wine grapes like Cabernet Sauvignon and Malbec, the countries' vineyards suffered from unusually heavy rain caused by the El Niño climate pattern
World famous wine producers like South Africa and France also took big hits from nasty weather. But increases in other major countries like Australia, the U.S. and Spain are expected to offset some of the damage. 
The decline in global production is set to make this year the worst since 2012. The drop that year helped contribute to a shortfall of nearly 300 million cases of wine, according to analysts at Morgan Stanley. 
It's unclear whether wine drinkers will face a similar shortage this time around. The OIV says it's too early to give definitive figures on wine consumption this year, but it is expected to rise from 2015. 
Wine producers and sellers often keep stocks of bottles in reserve in case of supply problems.

The entire continent of Australia sways (a little) with the weather

Google
Our planet does some weird stuff that escapes our notice simply because of scale. The Earth spins faster during an El Niño year—or after some earthquakes—but we’re never going to miss a millisecond here or there. It’s also easy to forget that the plates that make up the Earth’s crust are in constant motion, changing various locations incrementally. In fact, Australia will be updating GPS coordinates again this year to correct the continent’s drift away from its last-mapped whereabouts.
But that’s not all. It turns out that Australia—yes, the entire continent—tilts and slides around in a little dance each year because of seasonal weather patterns around the world.
University of Newcastle researcher Shin-Chan Han uncovered this finding while fiddling around with satellite data. Earth-observing satellites can detect many of the small, weird things the Earth does and may even need to account for them to preserve their precision. The exact center of Earth’s mass, for example, is known to wander a bit.
That wandering center of mass is a response to small changes in the distribution of mass around the Earth. Like a giant beach ball (made of solid rock…), squeezing in one place causes a response in other places. A major seasonal squeeze on the Earth is supplied by a see-saw of water that shifts weight around Europe and northern Africa on one side and the South Pacific Ocean on the other.
Han used a model to simulate the effects of that see-saw on the Earth’s center of mass and on Australia’s piece of the Earth’s surface. The simulation showed that Australia was on the pivot line of that see-saw, meaning that there actually ought to be a detectable annual wiggle. If this was the only thing going on, a cursory glance at any GPS station would reveal such motion. But Australia sits atop a fast-moving tectonic plate, sailing north at a pace of about seven centimeters each year. On top of that, Australia gets its own little squeeze from seasonal water weight, and things like earthquakes can periodically add jolts of motion here or there.
To see if the predicted migration of the Australian continent could be measured, Han had to remove all the other influences from the 14 GPS stations around the continent that had long enough records. First, he subtracted the consistent northward movement of the Australian plate. Then he subtracted the local effects of water measured by the GRACE satellites.
The twin GRACE satellites measure minute changes in Earth’s gravitational pull to find other changes in mass—like melting ice sheets or drought-depleted aquifers. They naturally measure with respect to the current center of mass, but they don’t track its motion for you. The location of this center has to be supplied for all the other measurements to be accurate.
Sure enough, the recorded motion that still remained in the GPS data showed a coherent pattern. The continent moves about a millimeter to the northwest during summer and fall, and back to the southeast during winter and spring. At the same time, Australia tilts toward the direction it’s moving—for a total slope of about 5 millimeters over 3,500 kilometers.
That vertical motion is half to one-third the average motion caused by local water weight, but the horizontal motion is actually the largest factor after plate motion.
Not even the most prone to motion sickness will need Dramamine to stomach this slight seasonal swing, but it’s pretty fun to think about. It’s enough that we can calculate the physics behind it. The fact that we apparently have instruments sensitive enough to reveal it in the real world is pretty incredible.
Fun aside, this demonstrates another way to track the Earth’s center of mass—so it can be accounted for in ridiculously sensitive measurements like these.

Election Day forecasted to be warmer than usual

Hundreds of warm temperature records will fall across large portions of the Central and Southern U.S. during the next two weeks, as the jet stream lifts north to a summer-like position across Canada, allowing unusually warm weather to move into the U.S. for an extended period of time. The warmth could last straight through election day.

The weather maps for the next 10 days look more like mid-to-late August than late October and early November, with storm systems zipping across Canada, and few, if any, outbreaks of cold air moving southward into the U.S.
This unusual weather pattern has implications for the presidential election, since a warmer-than-average, relatively tranquil election day would likely be ideal for maximizing voter turnout. 
Temperatures may be high enough through November 10 to threaten not only daily records, but even monthly records too, with highs running 10 to 20-plus degrees Fahrenheit above average from the end of October into the beginning of November in cities including Minneapolis, Omaha, Chicago, Dallas, Atlanta, Phoenix, Denver and Oklahoma City. 
Temperature outlook for November 4 to 10, 2016, showing milder than average conditions across the U.S., including Alaska. This includes election day.

Temperature outlook for November 4 to 10, 2016, showing milder than average conditions across the U.S., including Alaska. This includes election day.
IMAGE: NOAA/CPC
Many places across the U.S. will also be unseasonably warm during the run-up to Nov. 8, and many states, like Florida and Ohio, have already started early voting.
While this forecast could change, given the amount of uncertainty associated with predictions so far in advance, computer model projections are in agreement that nearly the entire country will be warmer-than-average and relatively storm-free on Nov. 8. 
Two exceptions may be the Mid-Atlantic and Northeast, where an area of low pressure, with cooler temperatures, may develop, as well as the Pacific Northwest.
Computer model projection of temperature anomalies on Nov. 8, 2016. Reddish hues correspond to unusually mild temperatures.

Computer model projection of temperature anomalies on Nov. 8, 2016. Reddish hues correspond to unusually mild temperatures.
IMAGE: WEATHERBELL ANALYTICS
Prior to voting day, however, record warmth will envelop areas outside the Northeast, California and Pacific Northwest. Thousands of people will go trick-or-treating during what is likely to be the warmest Halloween on record. 
In fact, you may want to rethink your costume if you're currently planning to go as a character or concept that requires multiple layers of clothing, given that it may feel like summer outside. 
This is especially the case if you are heading to a Halloween party in the Midwest, Plains or South.
For example, current forecasts call for a high temperature of at least 80 degrees Fahrenheit in St. Louis on Monday, which would be 20 degrees Fahrenheit above average for the date. Even Minneapolis, which typically can see snow on Halloween, may flirt with the 70-degree mark. 
CFS ensemble mean temperature departures from average from Oct. 28 to Nov. 7.

CFS ensemble mean temperature departures from average from Oct. 28 to Nov. 7.
IMAGE: WEATHERBELL ANALYTICS
The records that are set will only add to the massive imbalance between the number of record highs set so far in 2016 compared to record lows. Through Oct. 26, there were been 20,847 daily high temperature records set or tied in the U.S. this year, compared to just 3,920 record lows. 
That's an absolute blowout by a ratio of about 6-to-1, and is part of a long-term trend toward more high temperature records set each year compared to cold records. Studies have linked this trend to human-caused global warming.
The warm finish to October could help ensure that many locations in the Plains and South will set a monthly high temperature record, too.
The warm weather in early November does not mean that the U.S. will have a mild winter, however. In fact, there are indications the winter could be colder and snowier than average for many, particularly in the Upper Midwest, Northeast and Mid-Atlantic states.