Showing posts with label Brittany Smith. Show all posts

Wednesday, December 9, 2015

The Tornado That Couldn't Make Up Its Mind

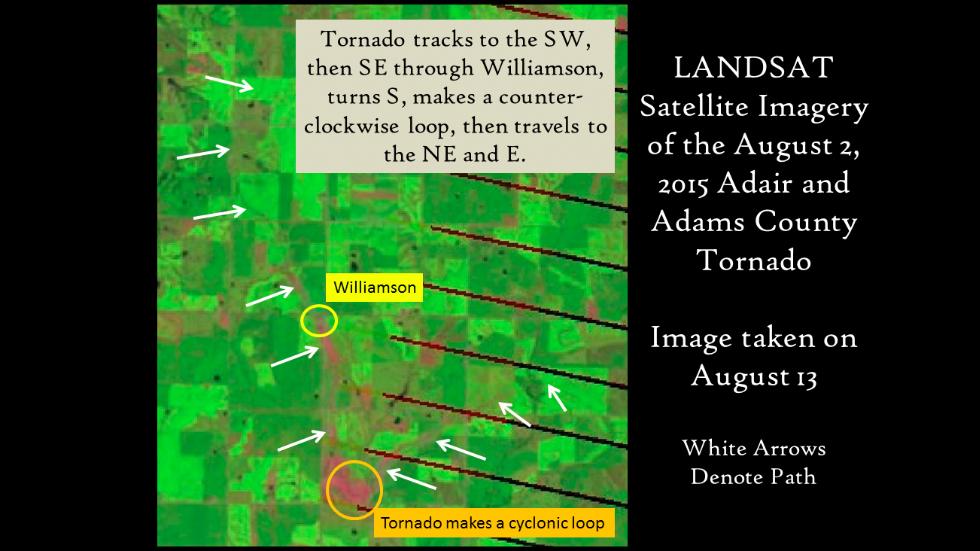
Satellite image showing the strange path of the Aug. 2, 2015 Iowa tornado. (Credit: National Weather Service Des Moines, Iowa)


Storm survey illustration of the strange path the Aug. 2, 2015 tornado took. (National Weather Service Des Moines, Iowa)
 
  The white arrows highlighting the tornado scar in the image show how it moved south initially, then made a cyclonic loop, before eventually heading back to the northeast. According to the NWS, the path of the tornado was in mostly rural portions of Adams County and Adair County. It was rated EF1, leaving some damage to silos and farm buildings about 8 miles north-northeast of Prescott, Iowa.             
 

The Big Thaw


**Peru's Quelccaya ice cap is the largest in the tropics. If it continues to melt at its current rate—contracting more than 600 feet (182.8 meters) a year in some places—it will be gone by 2100, leaving thousands who rely on its water for drinking and electricity high, dry, and in the dark.


So far, the results have been positively chilling. When President Taft created Glacier National Park in 1910, it was home to an estimated 150 glaciers. Since then the number has decreased to fewer than 30, and most of those remaining have shrunk in area by two-thirds. Fagre predicts that within 30 years most if not all of the park's namesake glaciers will disappear.

Scientists who assess the planet's health see indisputable evidence that Earth has been getting warmer, in some cases rapidly. Most believe that human activity, in particular the burning of fossil fuels and the resulting buildup of greenhouse gases in the atmosphere, have influenced this warming trend. In the past decade scientists have documented record-high average annual surface temperatures and have been observing other signs of change all over the planet: in the distribution of ice, and in the salinity, levels, and temperatures of the oceans.


http://environment.nationalgeographic.com/environment/global-warming/big-thaw/


Pacific Northwest Storm Parade to Bring More Rain

A parade of Pacific storms that began last week will continue to impact the Northwest into the coming weekend, though their nature will be changing from those producing flooding rain, to those with lower snow levels more typical of mid-December.

According to the National Weather Service, about 10 locations in southwest Washington and northwest Oregon have reported a foot or more of total rainfall in the three days ending 5 a.m. PST Wednesday. The top rainfall total so far is 18 inches at Lee's Camp in Oregon's northwest coastal range. Parts of coastal northwest Washington have seen 4 to 12 inches, while interior locations have seen 2 to 5 inches since this past weekend.

Rivers have topped flood stage at over two dozen river gauges in western Washington and northwest Oregon. Stretches of the Snoqalmie, Snohomish, Cowlitz and Chehalis Rivers, among others, are either forecast, or have already pushed into major flood stage Wednesday, but will fall by later Wednesday or Thursday.


http://www.weather.com/forecast/regional/news/ice-wind-snow-rain-northwest-dec-2015

Artic Sea Ice

he rate of ice growth for the first half of November 2015 was quite rapid, but the pace of ice growth slowed during the second half of the month, only to increase again at the end of the month. Throughout the month, sea ice extent remained within two standard deviations of the 1981 to 2010 average.


he unusual warmth at the 925 millibar level north of the Barents Sea is related to an atmospheric circulation pattern featuring unusually high sea level pressure centered over northern Eurasia and unusually low pressure centered over the Arctic Ocean and northern North Atlantic. The strong pressure gradient (difference in pressure) between the areas of high and low pressure led to strong (and apparently warm) winds from the south. Open water in this area also extends unusually far to the north; while this likely contributed to above average temperatures even as high as the 925 millibar level, the wind pattern itself likely also helped to keep the ice from advancing south.


http://nsidc.org/arcticseaicenews/

Winter Is 5 Weeks Away and New Hampshire's Mountains Are Covered in Rime Ice


An observer at the summit of Mt. Washington, N.H. (Credit: Jim Cantore)

Lenticular clouds hover near Mt. Washington, N.H. on Dec. 22, 2002

 
Pink and yellow hues paint a winter sunset from the balcony of the Mt. Washington Observatory.


Mount Washington, the tallest peak in the Northeast standing at 6,288 feet, and Mount Adams, sitting just below it at 5,794, are among the places that see the wild effects of rime ice.
Rime ice is supercooled droplets of water that freeze when they come in contact with an object, creating amazing formations that look as if they’re blown by the wind, but really they grow in the direction of the wind.


http://www.weather.com/science/news/new-hampshire-rime-ice

Derecho Produces Wind Damage

10 tornadoes were preliminarily confirmed by the National Weather Service in Iowa, including an EF2 tornado and a pair of EF1 tornadoes. One tornado near Avoca, Iowa overturned semis and destroyed outbuildings. Another tornado formed on the Mississippi River before moving into Le Claire, Iowa, removing the roof of one home and damaging several others.


http://www.weather.com/storms/tornado/news/severe-weather-forecast-november-10-11-2015

El Niño Creates More Favorable Conditions for Winter Tornadoes in Florida

A strong El Niño may raise the chances for an above-average tornado season this winter in Florida, according to meteorologists at the National Weather Service.
The Tallahassee office of the NWS says El Niño is known to push severe weather south in the winter, which leaves central and southern Florida in the bull's-eye. Upon studying El Niño years and otherwise, the NWS found a higher likelihood of tornadoes from November through April than with any other pattern.


The period from November 1997 through April 1998, influenced by one of the strongest El Niño events in recent memory, produced 43 tornadoes in Florida, which the NWS says was the worst year since records began. Of those 43 twisters, seven were at least F3 strength (this was before the Enhanced Fujita Scale was adopted).

http://www.weather.com/safety/tornado/news/el-nino-florida-tornadoes

Thursday, October 29, 2015

>>>>>>Watch a video<<<<<< of a Wet microburst

https://youtu.be/a_G2KRzha7o


Rain Bomb: Rare 'Wet Microburst’ Caught on Camera in Stunning Timelapse

A STORM chaser captures a huge burst of wind and rain which explodes in the sky and crashes to the ground. Shot on August 8, this dramatic timelapse was shot by photographer Bryan Snider, 29, in Tucson, Arizona. The incredibly detailed footage shows a weather event known as a wet microburst which occurs when a cooled column of air sinks rapidly through the middle of a thunder storm. The unique storm phenomena affects an area of no more than two and a half miles and can generate winds of over 150 mph. New Mexico-born Bryan lives and works in Phoenix, Arizona, as a full time videographer.

Videographer / Director: Bryan Snider, LSM
Producer: Mark Hodge, Chloe Browne
Editor: Joshua Douglas

Chicago Area Sets Record for Most Tornadoes in a Year in 2015


The severe weather season in northern Illinois typically doesn’t start heating up until late April, and the season generally peaks in June, but this year it started fast and furious. 
 
An unusually strong early spring storm system moved into the Midwest on Apr. 9, 2015. A northward push of humid, unstable air collided with cool, dry air draining down from the Plains. The perfect recipe for an early season tornado outbreak.
 
 
**Radar image of a tornado-producing supercell thunderstorm on the night of Apr. 9, 2015, near Rochelle, Illinois. 
                
 
The result was 14 tornadoes across the central U.S. that day, seven of which tore through northern Illinois. One of them was an EF-4 on the Enhanced Fujita Scale, which caused extensive damage in Rochelle, Illinois and surrounding areas. That EF-4 remains the strongest tornado reported in the U.S. so far in 2015.


HIGH TIDES IN SOUTH CAROLINA


**High tide, third highest on record, set Tuesday morning in Charleston, South Carolina, on October 27, 2015. (NOAA)

Only three events produced higher tides at Charleston Harbor: Hugo on Sep. 21, 1989 (12.56 feet), an August 11, 1940 hurricane (10.27 feet) and a New Year's Day 1987 coastal storm (8.84 feet) produced higher tides at Charleston Harbor.

Tuesday's tide level was 4-5 inches higher than the peak measured during the historic South Carolina flooding and coastal flooding event earlier in October. Fortunately this time, there wasn't 17-27 inches of rainfall occurring at the same time.


We mentioned earlier, there was no tropical storm, hurricane, or even bullish coastal low-pressure system associated with this event.

Instead, the pressure gradient between strong high pressure centered over the Northeast U.S. and low pressure over the northern Gulf Coast set up the persistent east to northeast winds driving water ashore.

http://www.weather.com/storms/severe/news/charleston-south-carolina-georgia-coastal-flooding

RECAP OF HURRICANE PATRICIA

Hurricane Patricia was a tropical cyclone that formed in the eastern Pacific and rapidly intensified into a Category 5 hurricane. Even more quickly than the storm strengthened, it rapidly weakened over the rugged terrain of Mexico.
Patricia initially formed on Oct. 20, 2015 and dissipated on Oct. 24, 2015.

Looking Back at Patricia

Just 30 hours after peaking in intensity as the most powerful tropical cyclone ever measured in the Western Hemisphere, former Hurricane Patricia degenerated into a weak remnant low over northeast Mexico.
On Oct. 23, Patricia became the most powerful tropical cyclone ever measured in the Western Hemisphere as its maximum sustained winds reached an unprecedented 200 mph (320 kph) and its central pressure fell to 879 millibars (25.96 inches of mercury).


Data from an Air Force Hurricane Hunter airborne reconnaissance mission late on the night of Oct. 22 provided critical data demonstrating the extreme intensification of Hurricane Patricia in near-real time. A new NOAA reconnaissance aircraft reached the eye of Patricia early on the afternoon of Oct. 23 to gather additional direct measurements of the storm's intensity.


Patricia's intensity decreased very quickly as the storm's center grinded across the rugged terrain of Mexico's interior.

The center of Patricia pushed inland on a track that spared Mexico's major cities from the worst damage, including the popular coastal resort cities of Manzanillo and Puerto Vallarta and the inland metropolis of Guadalajara, Mexico's second-largest city.

Rainfall was heavy enough to cause flooding and mudslides, including a slide in the state of Michoacán that took a section of roadway out with it, injuring two people whose vehicle fell into the slide.

http://www.weather.com/storms/hurricane/news/hurricane-patricia-mexico-coast

November Pattern Change Brings September Warmth to East and Mountain Snow, Cold to West


The polar jet stream will take a sharp southward nosedive in the West while simultaneously bulging northward into eastern Canada. 


**Weather Pattern the First Week of November
Blue streamlines trace the forecast jet stream over the U.S. in the first week of November. Beige and yellow indicates warmer temperatures. Bluer colors indicate colder air. Forecast model snow in West indicated by aqua, teal, purple, pink contours.
 
 
While a sharp cold front is delivering a chillier reality check to parts of the Midwest and Great Lakes right now, November's chilly, raw brand name couldn't be further from the truth in the week ahead.
With high pressure eventually setting up shop near the Eastern Seaboard, and generally lower pressure in the western U.S., a belt of warm air will flow northward from the southern Plains into the Upper Midwest, Great Lakes, Ohio Valley, and eventually into the Northeast in November's first week.

Midwest: 60s return to the northern Plains, Upper Midwest, southern Great Lakes this weekend into early in the week ahead. 70s possible from the central Plains to the southern Great Lakes, Ohio Valley, potentially for multiple days.
  • South: 70s in most areas with the exception of the Gulf Coast, Florida, central and south Texas where 80s will dominate.
  • Northeast: 60s in most areas except a few 50s in northern New England and some 70s in the mid-Atlantic states.

  • Thursday, October 8, 2015

    Severe Thunderstorms in the Plains


    Portions of the southern High Plains, central Plains and Midwest may see a few isolated severe thunderstorms and locally heavy rainfall on Thursday.

    An isolated severe threat is expected to develop farther east on Friday, along and ahead of a cold front. The risk of severe thunderstorms will stretch from portions of the interior Northeast into the Mid-Atlantic and into parts of the Tennessee Valley.

    Thursday
    • The threat for a few severe thunderstorms and flash flooding will persist from southern New Mexico into parts of western and southern Texas.
    • An isolated severe thunderstorm or two will be possible ahead of a cold front from northern Illinois, back into northern and central Missouri, southeastern Iowa and northeastern Kansas.
    Friday
    • Isolated severe thunderstorms will be possible from southern Pennsylvania and Maryland southward through West Virginia and southeastern Ohio into eastern portions of Kentucky, western Virginia and Tennessee.
    • Thunderstorms, generally non-severe, may fire once again across portions of far southern New Mexico into southwestern Texas.
    Saturday
    • No severe weather is expected, but a few thunderstorms may impact the coastal Carolinas, Georgia and the Florida peninsula.
    • A few thunderstorms may develop in parts of the Southwest as well.

    http://www.weather.com/storms/tornado/news/severe-weather-tracker-page

    Where the October Hurricane Threat Is the Greatest

    The map above shows the 13 hurricanes that have made landfall in October since 1950. Eight of those occurred in Florida and you can see the cluster of lines in south Florida in particular.

    The southwestern Atlantic Ocean, including off the Southeast coast of the U.S., and the eastern Gulf of Mexico are favorable areas for development in October, while the chance for storms to form in the eastern Atlantic becomes less likely. The western Caribbean Sea is also an area to watch for possible development, associated with the migration and extension of the monsoon trough from the eastern Pacific.

    Navarre Pier in Navarre Beach is pounded by massive waves during Hurricane Ivan in 2004. (Chris Duval/State Archives of Florida)
     

    A man is seen kayaking with his dog along a flooded street in Key West following Hurricane Wilma in 2005. (State Archives of Florida)

    Victims gather around a building devastated by a hurricane in 1896 in Cedar Key. (State Archives of Florida)
     
    Two men stand in Dupont Plaza in this photo taken in Miami during Hurricane Betsy in 1965. (State Archives of Florida)


    http://www.weather.com/storms/hurricane/news/october-hurricanes-florida-threat-20140930

    Decades-Old Oil Plume Underneath Pearl Harbor Contains More Than 5 Million Gallons of Fuel

    Royal Thai Navy personnel, Thai Army and local volunteers clean up Ao Phrao beach after a major oil slick hit the island of Ko Samet on July 31, 2013. (Nicolas Asfouri/AFP/Getty Images) 

     
    Streaks of crude oil cover the shore of Prao Bay on Samet Island in Rayong province eastern Thailand Monday, July 29, 2013. (AP Photo/Daily News) 
     
     
    The plume consists mostly of bunker fuel, a tar-like substance used by ships. Additionally, it contains weathered jet fuel and diesel. Because bunker fuel is so heavy, the state health department does not believe that the oil is moving and that it will not seep into the water soon. 
     
    However, if it were to seep into the water, it would cause a significant amount of marine and environmental damage.
     

    FIRE WEATHER OUTLOOK

     DAY 1 FIRE WEATHER OUTLOOK 
       NWS STORM PREDICTION CENTER NORMAN OK
       1127 AM CDT THU OCT 08 2015

       VALID 081700Z - 091200Z

       ...NO CRITICAL AREAS...

       NO CHANGES TO THE ONGOING FORECAST ARE NECESSARY. GUIDANCE AND
       CURRENT OBSERVATIONS CONTINUE TO SUGGEST THE LAX-TPH GRADIENT SHOULD
       STRENGTHEN TO AROUND -8 MB BY THE END OF THE PERIOD.
       NONETHELESS...THE RELATIVELY LOCALIZED NATURE OF THE OVERLAP BETWEEN
       GUSTY WINDS AND LOW RH VALUES /PRIMARILY CONFINED TO FAVORED CANYONS
       AND PASSES/ PRECLUDES THE INTRODUCTION OF AN ELEVATED DESIGNATION.

       ..PICCA.. 10/08/2015

       .PREV DISCUSSION... /ISSUED 0327 AM CDT THU OCT 08 2015/

       ...SYNOPSIS...
       UPPER LOW CURRENTLY CENTERED OVER FAR NRN MEXICO WILL SHIFT SWD
       THROUGHOUT THE DAY WHILE RIDGING BUILDS ACROSS THE INTERIOR PACIFIC
       NW...WRN GREAT BASIN...AND CA. FARTHER E...SHORTWAVE TROUGH
       CURRENTLY MOVING INTO NRN MN WILL CONTINUE EWD THROUGH THE GREAT
       LAKES REGION WHILE ANOTHER WEAKER SHORTWAVE TROUGH DROPS SEWD FROM
       MT INTO THE CNTRL PLAINS. AT THE SURFACE...LOW PRECEDING THE NRN MN
       SHORTWAVE WILL TAKE A SIMILAR PATH ACROSS THE GREAT LAKES WHILE AN
       ATTENDANT COLD FRONT DROPS THROUGH THE CNTRL PLAINS AND MID MS
       VALLEY. IN THE WAKE OF THIS FRONT...HIGH PRESSURE WILL BUILD IN
       ACROSS THE NRN/CNTRL PLAINS...UPPER MS VALLEY...AND GREAT BASIN.

       ...SRN CA...
       OFFSHORE GRADIENT IS EXPECTED TO GRADUALLY INCREASE THROUGHOUT THE
       PERIOD WITH THE LAX-TPH GRADIENT AROUND -8 MB BY 12Z/FRI. RESULTING
       GUSTY WINDS AND POOR OVERNIGHT RECOVERY WILL LIKELY PROMOTE SOME
       LOCALLY ELEVATED FIRE WEATHER CONDITIONS THROUGHOUT THE FAVORED
       PASSES AND CANYONS...PARTICULARLY ACROSS SAN LUIS OBISPO AND SANTA
       BARBARA COUNTIES. LOCALIZED NATURE OF THE FIRE WEATHER CONDITIONS
       CURRENTLY PRECLUDES THE NEED FOR ANY OUTLOOK AREAS. IF CONFIDENCE IN
       A LARGER SPATIAL EXTENT OF THESE FIRE WEATHER CONDITIONS
       INCREASES...AN ELEVATED AREA MAY BE NEEDED.

       ...PLEASE SEE WWW.SPC.NOAA.GOV/FIRE FOR GRAPHIC PRODUCT...

    http://www.spc.noaa.gov/products/fire_wx/fwdy1.html

    Thursday, September 24, 2015

    Hail in Italy

    A massive hailstone found near Pozzuoli, Italy.
     
    According to Jonathan Erdman, senior meteorologist for weather.com, the storm was brought on by a vigorous southward plunge of the jet stream that carved into western Europe sending a potent upper disturbance into the Italian peninsula Saturday. 
     
    "The satellite signature was classic for a severe thunderstorm, or cluster of storms."
     
    Baseball size hailstones fall from thunderstorms at speeds of at least 75 mph, so it's no wonder you can see the magnitude of smashed windshields and structural damage," said Erdman.
     

    A Rise in Sea Levels causes Floods

     
    **Water temperatures, which influence sea level, are expected to rise sharply in the 21st century along the eastern United States. Redder areas on the map show projected temperatures at the higher end of the scale. (Little et al., Nature Climate Change 2015)
     
     
    In the short term, flooding from this year's El Nino system could cause additional days of flooding across many U.S. coastal communities, with the worst impacts expected in the mid-Atlantic, the National Oceanic and Atmospheric Administration said in a report earlier this month.
     
    Glacier melt and the expansion of seawater as the ocean warms acts as the main drivers of sea-level rise around the world, both today and in the future. The U.S.'s East Coast might be in particular danger, as there, the sea is rising even faster than the 8-inch-since-1980 world average, past studies have found.


    http://www.weather.com/science/environment/news/massive-sea-level-rise-threatens-us-cities

    Pollen is in the Air


    According to the doctor, there are a number of reasons for the spring sniffles. “One is the rising long term increase in carbon dioxide and its effect on increased production of pollen,” he said.


    A study concluded that climate warming and the resultant weather effects are "an important factor" in causing the pollen season to be more intense, and this year Dr. Bassett expects the trend to continue. Climate warming and increased carbon dioxide is having a positive effect on pollen production (and thus a negative effect on those suffering from pollen allergens).

    http://www.weather.com/health/pollen/news/2015-pollen-season

    TORNADOES: Setting Record in the NWS


    The severe weather season in northern Illinois typically doesn’t start heating up until late April, and the season generally peaks in June, but this year it started fast and furious. 
     
    An unusually strong early spring storm system moved into the Midwest on Apr. 9, 2015. A northward push of humid, unstable air collided with cool, dry air draining down from the Plains. The perfect recipe for an early season tornado outbreak.